
A Guide to Probability and Statistics for Data Science
Jun 16, 2025 6 Min Read 8179 Views
(Last Updated)
In the data science-savvy world of today, understanding probability and statistics is not just beneficial; it’s essential. These foundational pillars facilitate extracting insights from data, enabling informed decision-making across various industries.
From hypothesis testing and regression analysis to data interpretation and statistical inference, probability and statistics for data science are redefining how organizations approach problem-solving and strategy formulation.
This guide will cover the crucial aspects of probability and statistics for data science, including essential probability concepts, key statistical techniques that empower data collection and analysis, and learning methods like sampling and set theory.
Table of contents
- Basics of Probability and Statistics for Data Science
- Definitions and Fundamental Concepts
- Probability vs. Statistics
- Why They Matter in Data Science
- Real-world Applications
- What is Probability and Statistics for Data Science?
- 1) Data Analysis and Interpretation
- 2) Predictive Modeling
- 3) Decision Making
- 4) Impact on the Data Science Field
- Foundational Concepts in Probability and Statistics
- 1) Probability Theory
- 2) Descriptive Statistics
- 3) Inferential Statistics
- Important Probability Concepts for Data Science [with examples]
- 1) Probability Distributions
- 2) Conditional Probability
- 3) Random Variables
- 4) Bayesian Probability
- 5) Calculating the p-value
- Important Statistical Techniques for Data Science [with examples]
- 1) Data Understanding
- 2) Hypothesis Testing
- 3) Regression Analysis
- 4) Clustering
- 5) Measures of Central Tendency: Mean, Median, and Mode
- 6) Measures of Dispersion: Variance and Standard Deviation
- Concluding Thoughts...
- FAQs
- Are probability and statistics used in data science?
- What is the science of statistics and probability?
- Is probability needed for a data analyst?
- What are the 4 types of probability?
Basics of Probability and Statistics for Data Science
Definitions and Fundamental Concepts
In data science, the interdisciplinary field that thrives on extracting insights from complex datasets, probability, and statistics is an indispensable tool. Probability theory, the bedrock of data science, quantifies uncertainty and is built on three fundamental cornerstones:
- Sample Space: Encompasses all potential outcomes of an event, such as the numbers 1 through 6 for a fair six-sided dice.
- Events: Specific outcomes or combinations of outcomes that are the building blocks for calculating probabilities.
- Probability: The quantification of the likelihood of an event, expressed between 0 (impossibility) and 1 (certainty).
These elements are crucial for analyzing data, making predictions, and drawing conclusions, with randomness significantly introducing variability into events.
Probability vs. Statistics
Probability and statistics, though closely related, serve distinct purposes in data science. Probability is used to predict the likelihood of future events based on a model, focusing on potential results.
Statistics, on the other hand, analyzes the frequency of past events to make inferences about the population from samples.
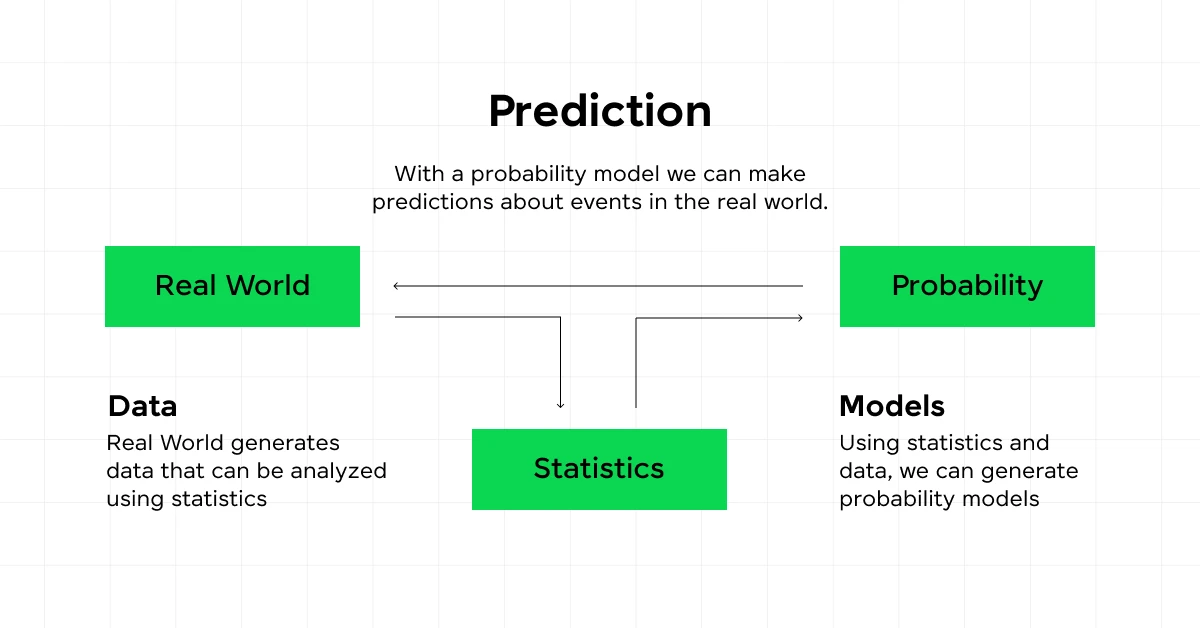
This dual approach allows data scientists to manage uncertainty effectively and make data-driven decisions.
Why They Matter in Data Science
Let’s understand a few reasons why probability and statistics matter in data science:
- Understanding probability and statistics is crucial for data scientists to simulate scenarios and offer valuable predictions.
- These disciplines provide a systematic approach to handling the inherent variability in data, supporting extensive data analysis, predictive modeling, and machine learning.
- By leveraging probability distributions and statistical inference, data scientists can draw actionable insights and enhance predictive accuracy.
Real-world Applications
Probability and statistics find applications across numerous data science sub-domains:
- Predictive Modeling: Uses historical data to predict future events, underpinned by probability theory to boost accuracy.
- Machine Learning: Algorithms employ probability to learn from data and make predictions.
- Extensive Data Analysis: Techniques derived from probability theory help uncover patterns, detect anomalies, and make informed decisions.
These principles are not only theoretical but have practical implications in various sectors, enabling data-driven decision-making and fostering innovation across industries. By mastering these concepts, you can unlock deeper insights from data and contribute to advancing the field of data science.
Before we move into the next section, ensure you have a good grip on data science essentials like Python, MongoDB, Pandas, NumPy, Tableau & PowerBI Data Methods. If you are looking for a detailed course on Data Science, you can join GUVI’s Data Science Course with Placement Assistance. You’ll also learn about the trending tools and technologies and work on some real-time projects.
Additionally, if you want to explore Python through a self-paced course, try GUVI’s Python course.
What is Probability and Statistics for Data Science?
Probability and statistics are integral to data science, providing the tools and methodologies necessary for making sense of raw data and turning it into actionable insights.
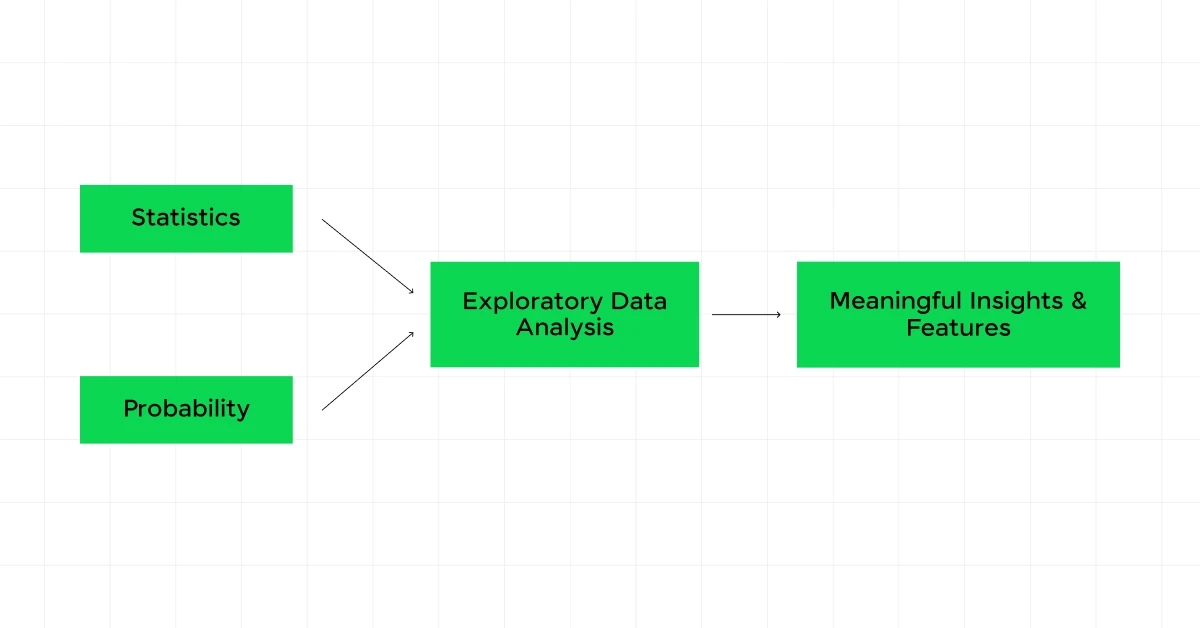
These disciplines help you, as a data science professional, to understand patterns, make predictions, and support decision-making processes with a scientific basis.
1) Data Analysis and Interpretation
Statistics is crucial for data analysis, helping to collect, analyze, interpret, and present data. Descriptive statistics summarize data sets to reveal patterns and insights, while inferential statistics allow you to make predictions and draw conclusions about larger populations based on sample data.
This dual approach is essential in data science for transforming complex data into understandable and actionable information.
2) Predictive Modeling
Predictive modeling uses statistical techniques to make informed predictions about future events. This involves various statistical methods like regression analysis, decision trees, and neural networks, each chosen based on the nature of the data and the specific requirements of the task.
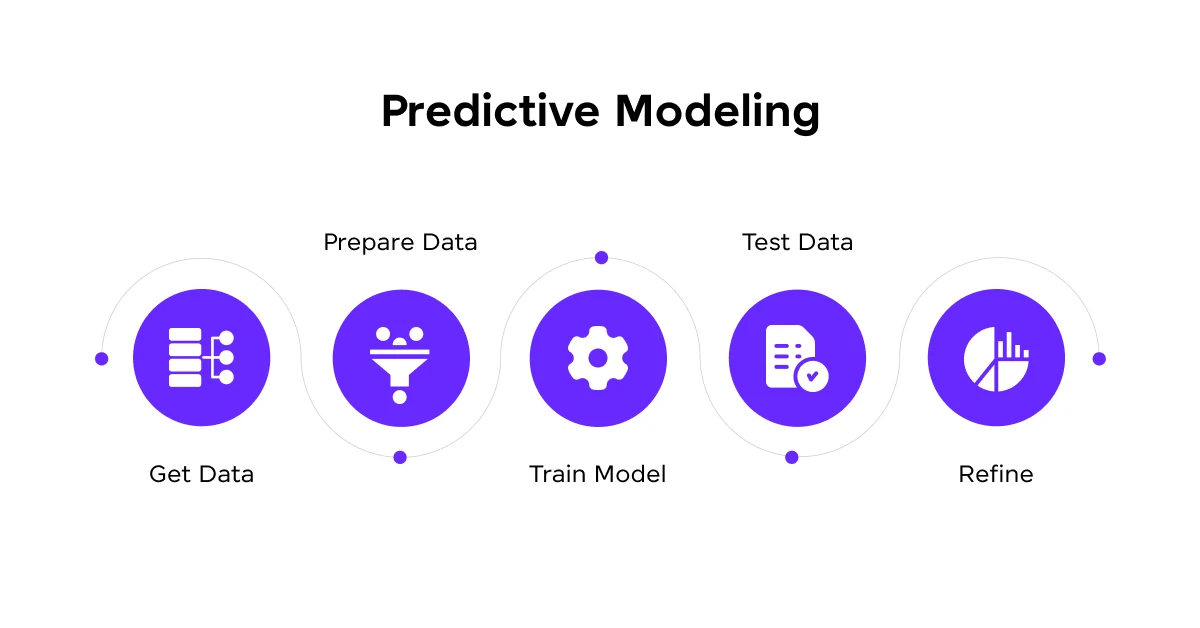
Probability plays a key role here, helping to estimate the likelihood of different outcomes and to model complex relationships within the data.
3) Decision Making
In the realm of data science, probability and statistics are fundamental for making informed decisions. Hypothesis testing, a statistical method, is particularly important as it allows data scientists to validate their inferences and ensure that the decisions made are not just due to random variations in data.
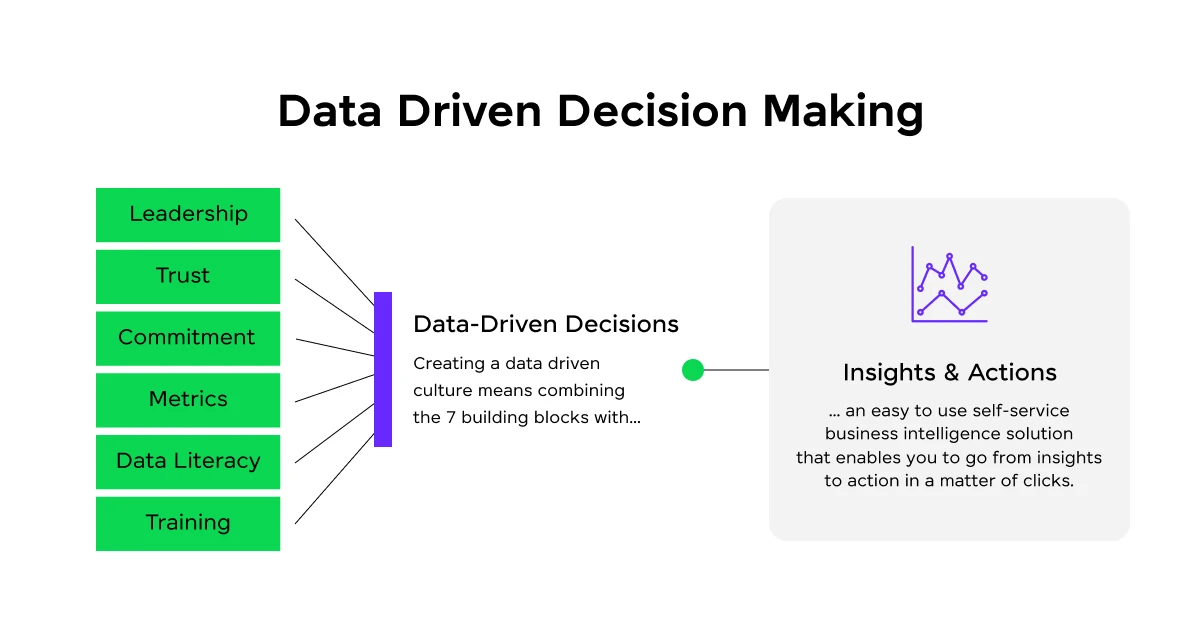
Statistical methods also aid in feature selection, experimental design, and optimization, all of which are crucial for enhancing the decision-making processes.
4) Impact on the Data Science Field
The impact of probability and statistics on data science cannot be overstated. They are the backbone of machine learning algorithms and play a significant role in areas such as data analytics, business intelligence, and predictive analytics.
By understanding and applying these statistical methods, data scientists can ensure the accuracy of their models and insights, leading to more effective strategies and solutions in various industries.
Incorporating these statistical tools into your data science workflow enhances your analytical capabilities and empowers you to make data-driven decisions, critical in today’s technology-driven world.
Foundational Concepts in Probability and Statistics
1) Probability Theory
Probability theory forms the backbone of data science, providing a framework to quantify uncertainty and predict outcomes.
At its core, probability theory is built on the concepts of sample space, events, and the probability of these events.
The sample space includes all possible outcomes, such as 1 through 6 when rolling a fair die. Events are specific outcomes or combinations, and probability quantifies their likelihood, ranging from 0 (impossible) to 1 (certain).
2) Descriptive Statistics
Descriptive statistics are crucial for summarizing and understanding data. It involves measures of central tendency and variability to describe data distribution. Central tendency includes mean, median, and mode:
- Mean provides an average value of data, offering a quick snapshot of the dataset’s center.
- Median divides the data into two equal parts and is less affected by outliers.
- Mode represents the most frequently occurring value in the dataset.
Variability measures, such as range, variance, and standard deviation, describe the spread of data around the central tendency. These measures are essential for understanding the distribution and reliability of data.
3) Inferential Statistics
Inferential statistics allows data scientists to make predictions and inferences about a larger population based on sample data. This branch of statistics uses techniques like hypothesis testing, confidence intervals, and regression analysis to draw conclusions.
For example, hypothesis testing can determine if the differences in two sample means are statistically significant, helping to confirm or reject assumptions.
Table: Key Statistical Measures and Their Applications
| Measure | Description | Application |
|---|---|---|
| Mean | Average of all data points | Central tendency |
| Median | The most frequent data point | Central tendency, less outlier impact |
| Mode | Difference between the highest and lowest value | Commonality analysis |
| Range | The square root of variance | Data spread |
| Variance | Average of squared deviations from mean | Data variability |
| Standard Deviation | The square root of variance | Data dispersion |
Incorporating these foundational concepts in probability and statistics not only enhances your analytical capabilities but also empowers you to make informed, data-driven decisions in the field of data science.
Important Probability Concepts for Data Science [with examples]
1) Probability Distributions
Probability distributions are mathematical functions that describe the likelihood of various outcomes for a random variable.
These distributions are essential in data science for analyzing and predicting data behavior.
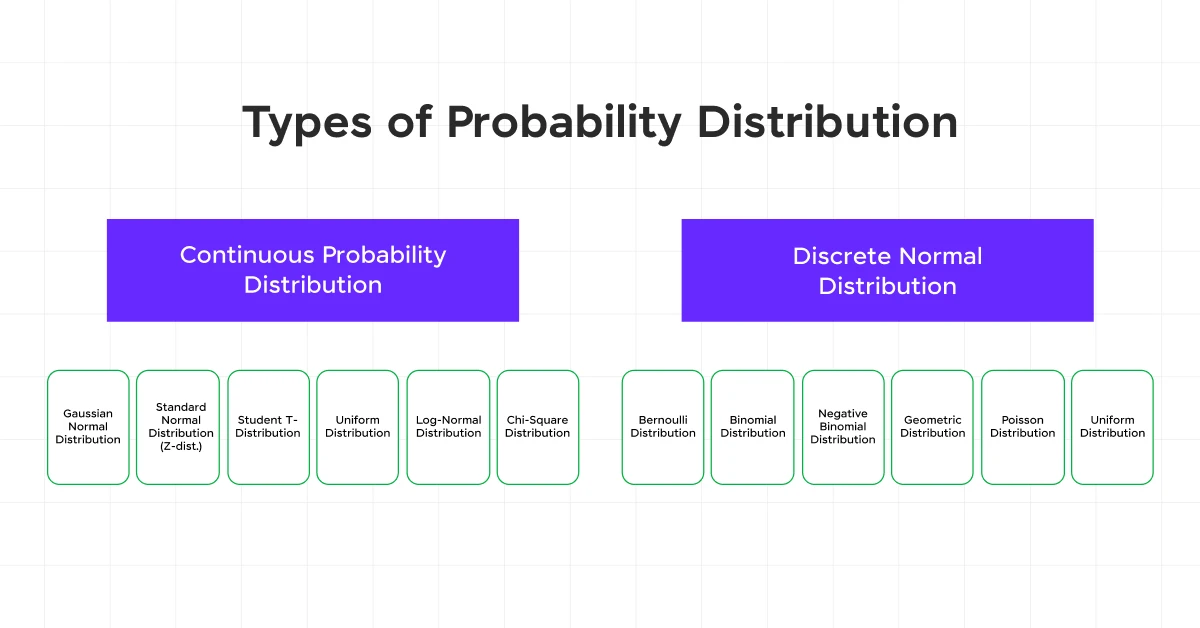
For instance, a Bernoulli distribution, which has only two outcomes (such as success or failure), can model binary events like a coin toss where the outcomes are heads (1) or tails (0).
2) Conditional Probability
Conditional probability assesses the probability of an event occurring given that another event has already occurred.
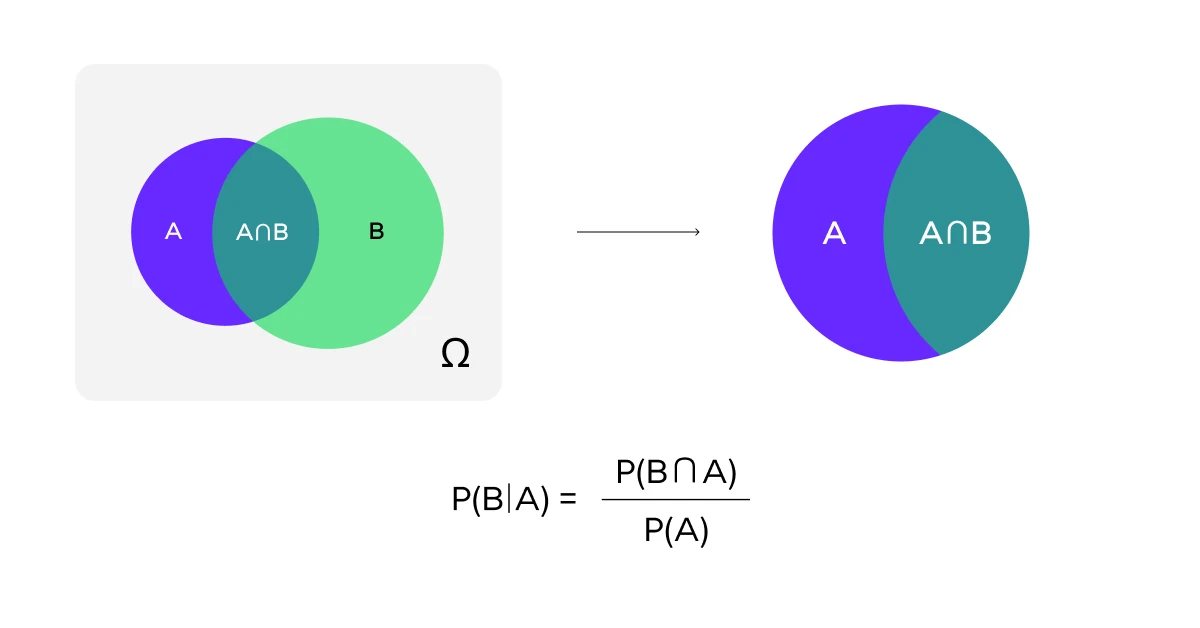
For example, consider the probability of selling a TV on Diwali compared to a normal day. If on a normal day, the probability is 30% (P(TV sale on a random day) = 30%), it might increase to 70% on Diwali (P(TV sale given today is Diwali) = 70%).
This concept helps in refining predictions in data science by considering the existing conditions.
3) Random Variables
A random variable is a variable whose possible values are numerical outcomes of a random phenomenon.
For example, if X represents the number of heads obtained when flipping two coins, then X can take on the values 0, 1, or 2.
The probability distribution of X would be P(X=0) = 1/4, P(X=1) = 1/2, P(X=2) = 1/4, assuming a fair coin.
4) Bayesian Probability
Bayesian probability is a framework for updating beliefs in the light of new evidence. Bayes’ Theorem, P(A|B) = P(B|A)P(A)/P(B), plays a crucial role here.
For instance, if you want to calculate the probability of an email being spam (A) given it contains the word ‘offer’ (B), and you know P(contains offer|spam) = 0.8 and P(spam) = 0.3, Bayes’ theorem helps in updating the belief about the email being spam based on the presence of the word ‘offer’.
5) Calculating the p-value
The p-value helps determine the significance of the results when testing a hypothesis. It is the probability of observing a test statistic at least as extreme as the one observed, under the assumption that the null hypothesis is true.
For example, if a p-value is lower than the alpha value (commonly set at 0.05), it suggests that the observed data are highly unlikely under the null hypothesis, indicating a statistically significant result.
Table: Key Concepts and Their Applications
| Concept | Description | Example |
|---|---|---|
| Probability Distributions | Mathematical functions describing outcome likelihoods | Bernoulli distribution for coin tosses |
| Conditional Probability | Probability of observing the test statistic under null hypothesis | Increased sales on Diwali vs. a normal day |
| Random Variables | Variables representing numerical outcomes of randomness | Number of heads in coin tosses |
| Bayesian Probability | Framework for belief update based on new evidence | Spam detection using Bayes’ theorem |
| p-value | Probability of observing the test statistic under the null hypothesis | Significance testing in hypothesis tests |
By understanding these concepts, you can enhance your ability to analyze data, make predictions, and drive data-driven decisions in the field of data science.
Important Statistical Techniques for Data Science [with examples]
1) Data Understanding
Data understanding is pivotal in data science, involving a thorough assessment and exploration of data to ensure its quality and relevance to the problem at hand.
For instance, before launching a project, it’s crucial to evaluate what data is available, how it aligns with the business problem, and its format.
This step helps in identifying the most relevant data fields and understanding how data from different sources can be integrated effectively.
2) Hypothesis Testing
Hypothesis testing is a fundamental statistical technique used to determine if there is enough evidence in a sample of data to infer a particular condition about a population.
For example, using a t-test to compare two means from different samples can help determine if there is a significant difference between them.
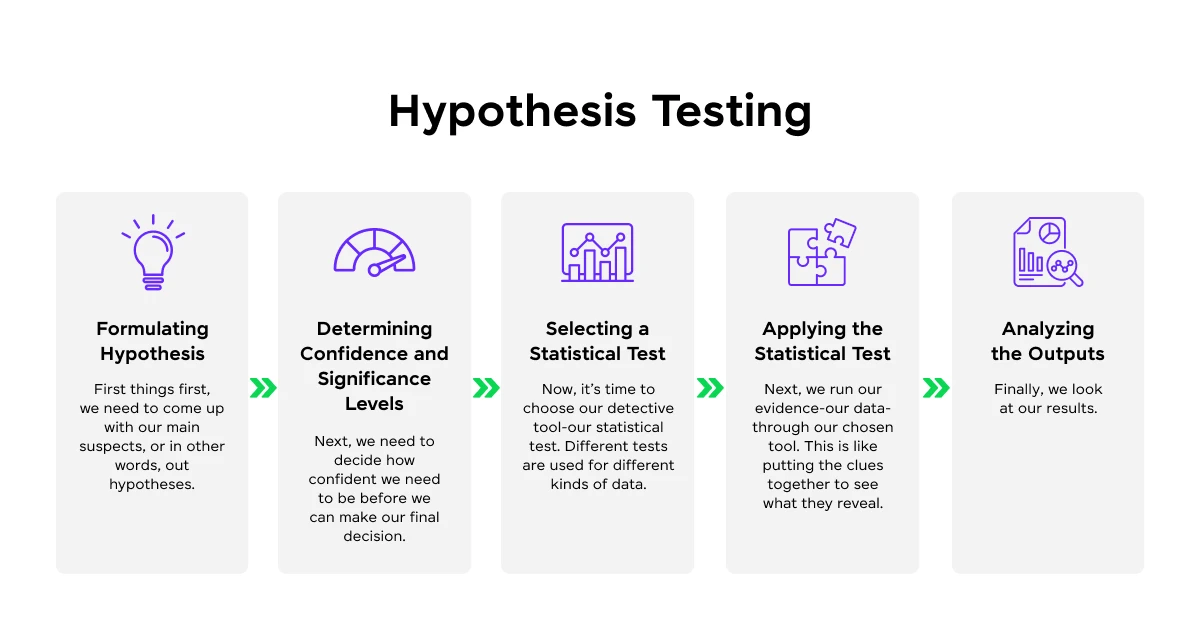
This method is crucial for validating the results of data science projects and ensuring that decisions are based on statistically significant data.
3) Regression Analysis
Regression analysis is a powerful statistical tool used to model relationships between dependent and independent variables.
This technique is essential for predicting outcomes based on input data. For example, linear regression can be used to predict housing prices based on features such as size, location, and number of bedrooms.
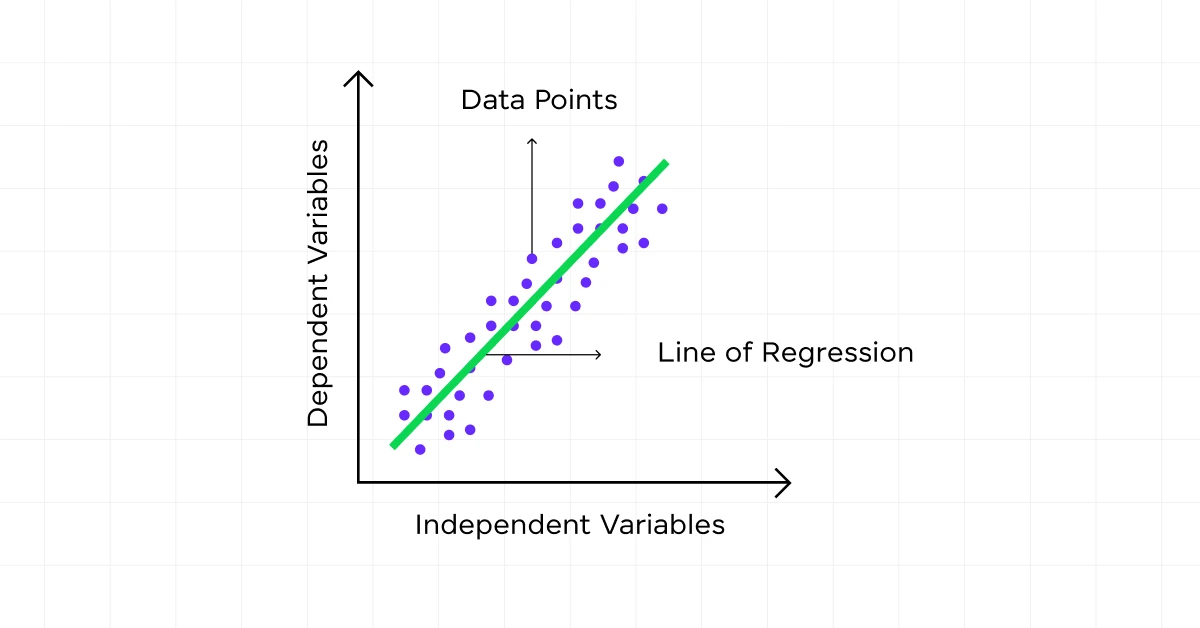
The relationship is typically modeled through a linear equation, making it possible to predict the dependent variable based on known values of the independent variables.
4) Clustering
Clustering is an unsupervised learning technique used to group a set of objects in such a way that objects in the same group are more similar to each other than to those in other groups.
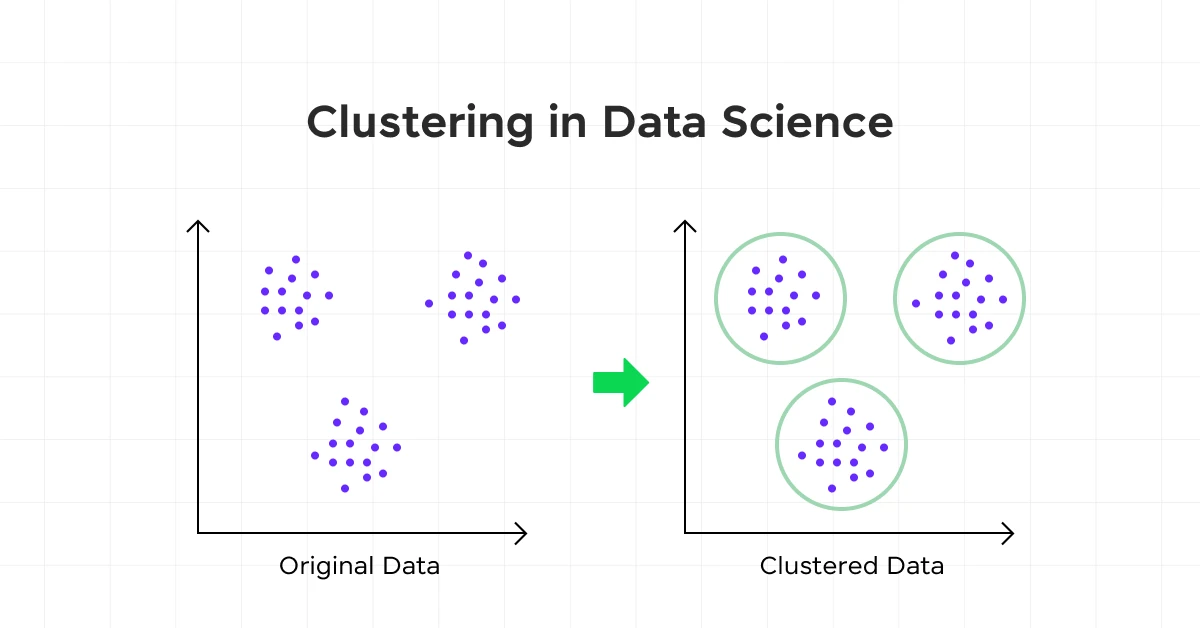
For example, k-means clustering can be used to segment customers into groups based on purchasing behavior, which can then inform targeted marketing strategies.
This technique is valuable for discovering natural groupings in data without prior knowledge of group definitions.
5) Measures of Central Tendency: Mean, Median, and Mode
Understanding the central tendency of data is crucial in data science.
- The mean provides an average value, offering insights into the central point of a data set.
- The median offers a middle point that is less influenced by outliers, and the mode indicates the most frequently occurring value.
These measures help summarize data sets, providing a clear overview of data distribution and central values.
6) Measures of Dispersion: Variance and Standard Deviation
Measures of dispersion like variance and standard deviation are critical for understanding the spread of data around the central tendency. V
Variance indicates how data points in a set are spread out from the mean. For example, if the variance is high, data points are more spread out from the mean.
Standard deviation, the square root of variance, provides a clear measure of spread, helping to understand the variability within data sets. This is essential for data scientists to assess risk, variability, and the reliability of data predictions.
Table: Key Statistical Techniques and Examples
| Technique | Description | Example Use-Case |
|---|---|---|
| Hypothesis Testing | Tests assumptions about a population parameter | Determining if new teaching methods are effective |
| Regression Analysis | Models relationships between variables | Predicting real estate prices based on location and size |
| Clustering | Groups similar objects | Customer segmentation for marketing strategies |
| Mean, Median, Mode | Measures of central tendency | Summarizing employee satisfaction survey results |
| Variance & Standard Deviation | Measures of data spread | Assessing investment risk by analyzing returns variability |
By leveraging these statistical techniques, you can enhance your ability to analyze data, make accurate predictions, and drive effective data-driven decisions in the field of data science.
Kickstart your Data Science journey by enrolling in GUVI’s Data Science Course, where you will master technologies like MongoDB, Tableau, PowerBI, Pandas, etc., and build interesting real-life projects.
Alternatively, if you want to explore Python through a self-paced course, try GUVI’s Python course.
Concluding Thoughts…
Throughout this guide, we learned about the importance of probability and statistics for data science, underscoring their significance in garnering insights from vast datasets and informing decision-making processes.
We discussed at length the essential probability theories and scrutinized pivotal statistical techniques that empower data scientists to predict, analyze, and infer with heightened accuracy and reliability.
Our discussion of predictive modeling, hypothesis testing, and the utilization of various statistical measures lays the groundwork for innovative solutions and strategic advancements across industries.
Probability and Statistics will always be relevant and very important in the future of data science, and I hope this article will serve as a helpful guide to get you started.
FAQs
Yes, probability and statistics are fundamental to data science for analyzing data, making predictions, and deriving insights from data sets.
Statistics and probability involve the study of data collection, analysis, interpretation, and presentation, focusing on understanding patterns and making inferences from data.
Yes, a strong understanding of probability is essential for data analysts to interpret data correctly and make accurate predictions.
The four types of probability are classical, empirical, subjective, and axiomatic probability.






![Top Data Science Programming Languages All Beginners Must Know [2025] 15 data science programming language](https://www.guvi.in/blog/wp-content/uploads/2025/06/Feature-Image-3.png)





Did you enjoy this article?