
Do you have a data science interview coming up? Not sure of what to expect? Don’t worry, we’ve got you covered!
In this blog, we will guide you through the steps to prepare for data science interviews and present you with the top 30 data science interview questions that are frequently asked. This blog summarizes everything for you to skim through the day before and ace the interview with ease. Let’s get started!
Table of contents
- Steps to Prepare for an Interview
- Brush up Your Basic Skills
- Understand the Job Description and Prepare for Specific Topics
- Attend Mock Interviews
- Top 30 Data Science Interview Questions With Answers
- Basic Data Science Knowledge
- Machine learning algorithms and statistics-based Questions
- Programming and Tools-based Questions
- Conclusion
- FAQs
- What should I include in my data science portfolio?
- How can I demonstrate my problem-solving skills during an interview?
- What should I do if I get stuck on a coding problem during the interview?
- What kind of questions should I ask the interviewer?
Steps to Prepare for an Interview

First things first, let’s jump into the steps to prepare for interviews. To attend any interview, the first thing you need is confidence. This confidence comes from the fact that you are well prepared and ready to answer any kind of question. By validating your skillset, you can build your confidence. Let’s look into the skills and how you can increase your confidence for the interview.
Brush up Your Basic Skills
The initial step of preparing for your data science interview is to brush up on your basic skills. The basic skills required for a data science role include Python, mathematics, statistics, data analysis, data processing, machine learning algorithms and evaluation metrics. Having a decent understanding of the important concepts in each skill will help you boost your confidence in attending the interview. You can find the important concepts of each skill below.
- Python: Variable declarations, functions, classes, objects and other pillars of object-oriented programming.
- Mathematics: It includes linear algebra, calculus, and probability theory.
- Statistics: Hypothesis testing, regression analysis, and data distribution.
- Data Analysis: This involves data cleaning, exploration, processing, model building and visualization using Python libraries such as numpy, pandas and scikit-learn.
- Machine Learning Algorithms: Supervised(trained on labeled dataset), unsupervised(trained on unlabeled dataset), reinforcement learning, classification, regression, clustering, and recommendation systems.
- Evaluation Metrics: Accuracy, Precision, F1-score, Confusion matrix, Mean Absolute Error(MAE), Root Mean Squared Error (RMSE) and Mean Squared Error (MSE).
Understand the Job Description and Prepare for Specific Topics
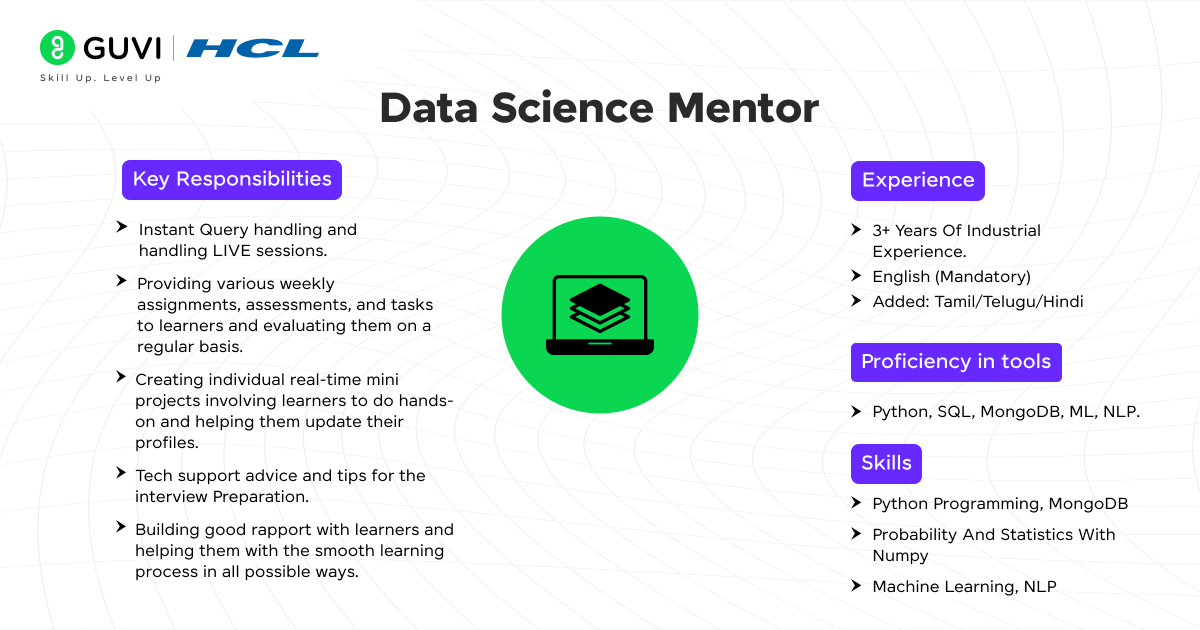
Once you brush up on your basic skills required for data science, read the job description carefully and understand what they are expecting from the candidate. For example, let’s consider Guvi’s job description for a data scientist role.
This is a Data Science Mentor job description at Guvi. If you look closely at the skills, tools and responsibilities sections you can find the most important things they look for in a candidate. They need a person with good communication skills, who has knowledge of teaching, tools such as SQL, MongoDB, ML, NLP and a capstone project to showcase your expertise.
For this job description, the new skills include NLP, MongoDB and SQL. You can skim through the new technologies they listed that you don’t know to boost your confidence further.
Attend Mock Interviews
To increase your confidence further and avoid being nervous during the interview, you can practice mock interviews with your friends or mentors. Practicing makes the man perfect. It takes a lot of practice to avoid the nervousness and the anxiety we feel during the interview.
Check out our blog on How to Crack a Data Science Interview in 6 Steps to learn more about the skills and resources for data science roles. If you want to learn the necessary skills required for a data science starting from scratch to advance from India’s top Industry Instructors, consider enrolling in GUVI’s Zen class course “Become a Data Science Professional with IIT-M Pravarta” that not only teaches you everything about data science, but also provides you with hands-on project experience an industry-grade certificate!
Top 30 Data Science Interview Questions With Answers
In this section, we will look into the top 30 data science interview questions that are frequently asked in interviews. These questions cover concepts from the basic to the advanced level. During the interview, you may be asked to answer behavioural questions. There is less possibility of behavioural questions, here we will cover all the conceptual questions related to data science. Let’s jump into it without further delay.
Basic Data Science Knowledge
1. What is Data Science?
By the name itself, we can say that it is a science about data. Data science is the study of data to extract meaningful information and insights. Data science is used to provide a data-driven solution to real-world problems. It includes maths, statistics, machine learning(ML) and artificial intelligence(AI).
2. What are the steps involved in the data science lifecycle?
Building a data science project involves various steps that include:
- Define the Problem: As a first step, identify the business question or objective you want to address with your data science project.
- Data Collection: The second step is to gather relevant data from various sources, including databases or web scraping, depending on the project’s needs.
- Data Cleaning: Next, clean and pre-process the data by handling missing values, outliers, inconsistencies, and formatting issues.
- Exploratory Data Analysis (EDA): This step is to visualize and analyze the data to understand its characteristics, patterns, and relationships between variables using techniques like histograms, scatterplots, and correlation matrices.
- Feature Engineering: In this step, you will create new features from existing data that might be more predictive for your model.
- Model Building: For building a predictive model, select appropriate machine learning algorithms based on your problem and train models on the prepared data.
- Model Evaluation: After building the model, assess the performance of the model using metrics like accuracy, precision, recall, and F1-score on a test dataset.
- Deployment: The last step is to integrate the best-performing model into a production environment where it can be used to make predictions on new data.
3. What is the difference between supervised and unsupervised learning?
Supervised Learning: It is a machine learning algorithm that is trained on labeled data (i.e., input-output pairs). The goal of supervised learning is to map the input data to the output labels. Example supervised learning algorithms include classification and regression algorithms. Example problem statements are spam detection and cancer detection using classification algorithms.
Unsupervised Learning: It is a machine learning algorithm that is trained on an unlabeled dataset (i.e., no pairs). The main goal of unsupervised learning is to find the hidden patterns or structures in the data and predict the output based on them. Clustering algorithms and Dimensionality reduction algorithms are examples of unsupervised learning algorithms. Example problem statements are video recognition and product recommendations.
4. What’s the difference between the concepts of overfitting and underfitting in machine learning?
Overfitting: Overfitting occurs in a model when the model learns the noise or random fluctuations in the training dataset rather than the actual underlying patterns. It results in poor performance on new or unseen data. To resolve this problem, you can use regularization (L1/L2) and cross-validation methods.
Underfitting: Underfitting occurs in a model when it is too simple to capture the underlying trends in the data. It can lead to wrong predictions on unseen data. It can be solved by using complex models, increasing the number of features or decreasing the regularizations.
5. What is A/B testing in Data science?

A/B Testing is a statistical method to compare two versions (A and B) of a webpage, app, or other digital asset to determine which one performs better. It involves splitting the audience into two groups and analyzing the impact of changes on a specific metric.
6. What are some common techniques used for handling missing data?
Techniques include:
- Deletion or removal of the specific row or column
- Replacing the missing values with estimated values using statistical methods such as the mean, median.
- Using forward and backward fill methods that use the values from previous or next observations to fill the missing values.
7. What is the Curse of Dimensionality?
The Curse of Dimensionality refers to the phenomenon where the feature space becomes increasingly sparse as the number of features grows, making it harder for models to generalize. It can lead to overfitting and requires techniques like dimensionality reduction to manage effectively.
8. What are bias and variance? How do they affect model performance?
Bias: It is an error that occurs due to overly simplistic assumptions in the model, which can cause underfitting of the model.
Variance: It is also an error due to the model’s sensitivity to small fluctuations in the training data, which can lead to overfitting.
The model should maintain a balance between bias and variance to minimize total error.
9. What is feature engineering?
Feature engineering involves creating new features or modifying existing features to improve the model’s performance. The best feature engineering can significantly increase the accuracy of the predictive model by providing more relevant information to learn from the dataset.
10. What is a confusion matrix?
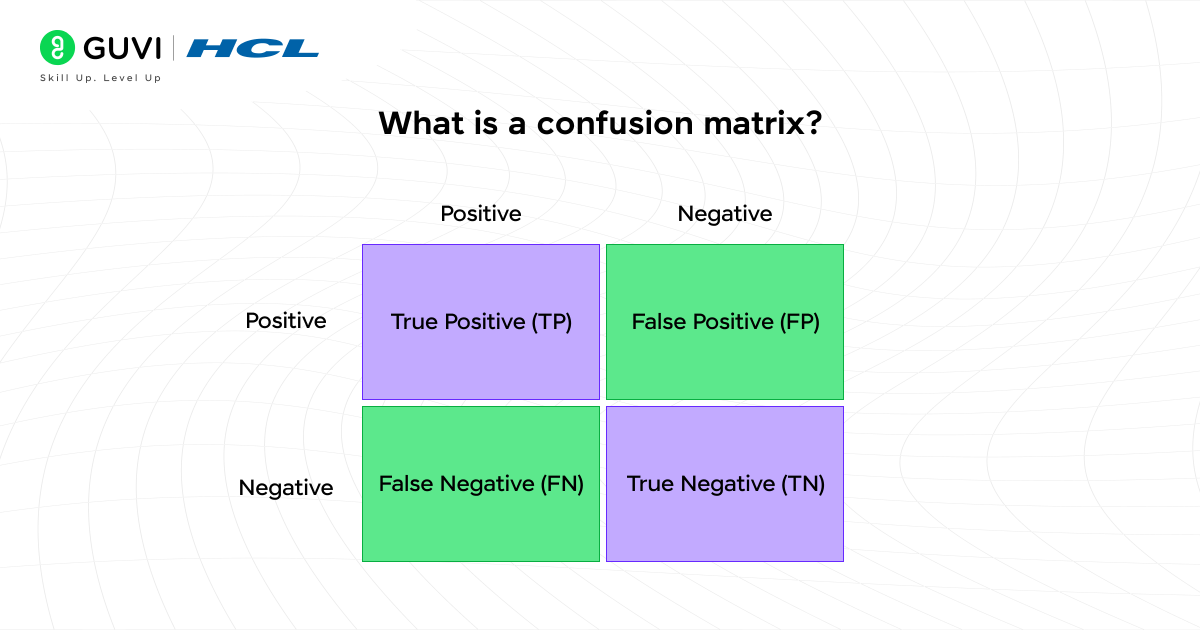
A confusion matrix is a table used to evaluate classification models, showing the actual versus predicted class labels. It includes the following:
- True Positive (TP): The model correctly predicted a positive outcome
- True Negative (TN): The model correctly predicted a negative outcome
- False Positive (FP): The model incorrectly predicted a positive outcome. Also known as Type I error.
- False Negative (FN): The model incorrectly predicted a negative outcome. Also known as a Type II error.
Machine learning algorithms and statistics-based Questions
11. Can you explain the working of the Random Forest Algorithm?
Random forest is an ensemble learning algorithm that builds multiple decision trees. Each tree is trained on a random subset of the dataset and features and then aggregates its predictions for a final result that improves accuracy and stability.
12. What are the common ensemble methods?
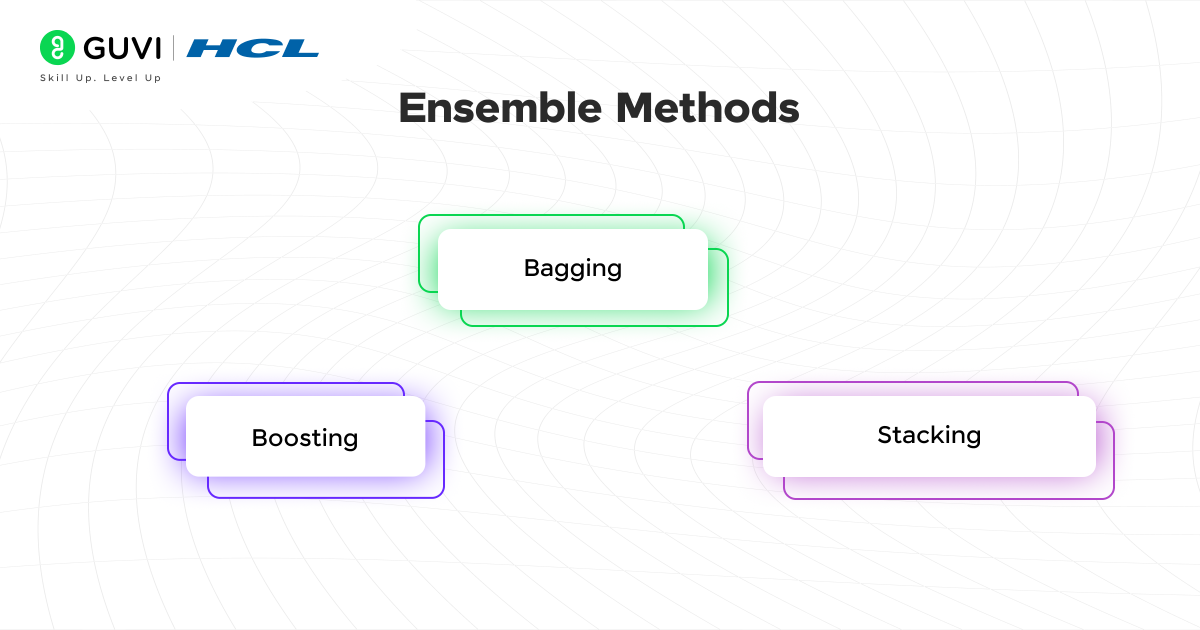
Ensemble methods are machine learning techniques that combine multiple models to improve the accuracy of the prediction model. It is mostly used in supervised learning algorithms such as classification and regression. The popular ensemble methods are:
- Bagging: It is also known as aggregating. It is used to train multiple models independently on different subsets of the data. Example: Random forest
- Boosting: This method trains the model sequentially, so that each model learns from the mistakes of the previous model. Example: Gradient Boosting and AdaBoost
- Stacking: This method combines the predictions of multiple base models by training a meta-model to make a final prediction more accurate. Example: Combining predictions from different models
13. What is a Time Series analysis?
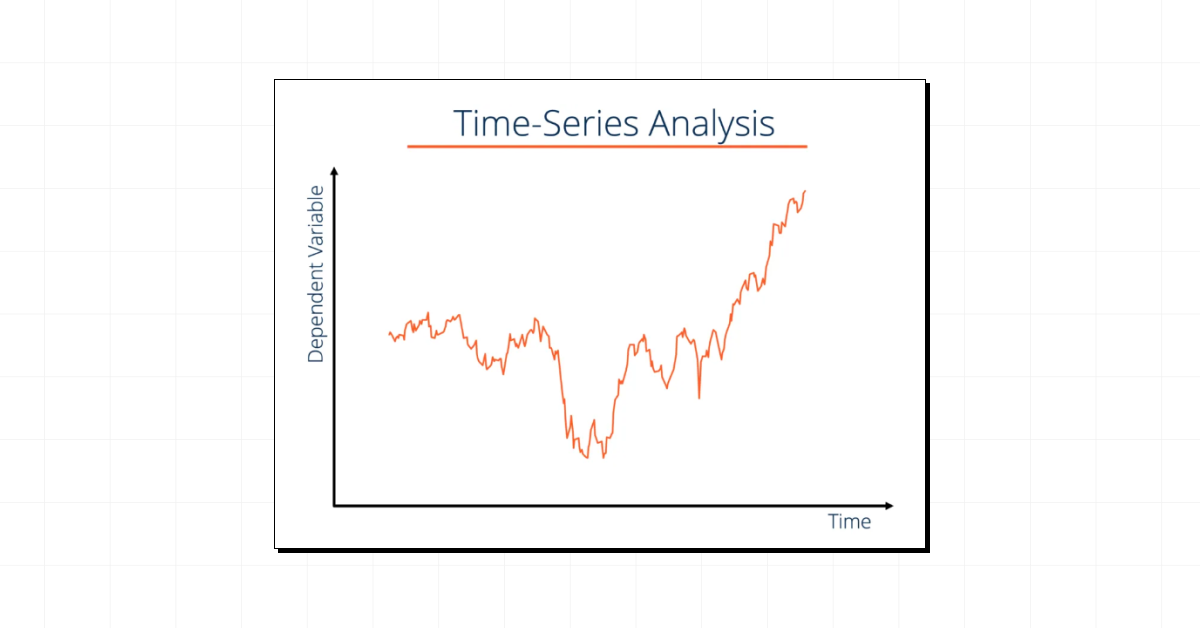
Time Series Analysis involves analyzing data points collected or recorded at specific time intervals. It includes methods for modeling and forecasting future data points based on historical data. Common techniques include ARIMA and Exponential Smoothing.
14. What is the difference between K-Means and K-Nearest Neighbors (KNN)?
K-Means is a clustering algorithm that partitions data into K clusters based on the similarity of data points.
K-Nearest Neighbors (KNN) is a classification algorithm that assigns a class to a data point based on the classes of its K nearest neighbors.
15. What is a Neural Network?
A Neural Network is a series of algorithms that mimic the operations of a human brain to recognize patterns. It consists of layers of interconnected nodes (neurons) that process data in a way that allows the network to learn complex patterns and make predictions.
15.1 What are Activation Functions in Neural Networks? (Follow-up questions)
Activation Functions determine whether a neuron should be activated or not. They introduce non-linearity into the network, allowing it to learn complex patterns. Common activation functions include ReLU (Rectified Linear Unit), Sigmoid, and Tanh.
16. What is Naive Bayes and when do you use it?
Naive Bayes is a probabilistic classifier model based on Bayes’ theorem. It assumes that all the features are conditionally independent. It is effective for large datasets and text classification problems such as spam detection and sentiment analysis.
17. What is a Z-score?
A z-score is a statistical measure that measures how many standard deviations a data point is from the mean of the distribution. Z-scores are usually used to identify outliers or to compare values from different distributions. The formula is given as:
Where X is the data point, μ is the mean and σ is the standard deviation.
18. What is a Decision Tree?
A decision tree is a supervised learning algorithm that uses a tree-like structure to make decisions by evaluating features and following a series of rules in the nodes of the tree. It is similar to a flowchart structure, where each node represents a condition or test and each branch represents an outcome of the test, which leads to the final prediction.
19. What is a Support Vector Machine (SVM)?
SVM is also a supervised learning algorithm used for both classification and regression tasks. It is particularly useful in finding an optimal boundary (hyperplace) that separates data points of different classes, maximizing the margin between them. SVM fits for applications that include image and text classification, and bioinformatics.
20. What is a p-value in Hypothesis Testing?
A p-value is a measure of the evidence against a null hypothesis. A low p-value (typically < 0.05) indicates strong evidence against the null hypothesis, suggesting that the observed effect is statistically significant.
Programming and Tools-based Questions
21. What is the difference between SQL and NoSQL databases? When would you use it?
| Feature | Relational Databases(SQL) | NoSQL |
| Definition | It stores data in structured tables. | It stores data in non-structured formats such as json, graphs. |
| Schema | It uses a predefined schema. | It uses a flexible schema. |
| Scalability | It uses horizontal scaling. | It uses vertical scaling. |
| Query language | Structured Query language(SQL) | No standard language. It uses APIs. |
| Examples | MySQL, PostgreSQL, Oracle. | MongoDB, Cassandra, Redis. |
22. Write a Python program to calculate the mean, median and mode of a given list of numbers
| from collections import Counter def calculate_statistics(numbers): # Mean mean = sum(numbers) / len(numbers) # Median sorted_numbers = sorted(numbers) n = len(numbers) if n % 2 == 0: median = (sorted_numbers[n//2 – 1] + sorted_numbers[n//2]) / 2 else: median = sorted_numbers[n//2] # Mode counts = Counter(numbers) mode = counts.most_common(1)[0][0] # Most frequent value return mean, median, mode # Example usage: numbers = [1, 2, 2, 3, 4] mean, median, mode = calculate_statistics(numbers) print(f”Mean: {mean}, Median: {median}, Mode: {mode}”) |
23. Write a Python function to split data into training and testing sets.
| from sklearn.model_selection import train_test_split def split_data(X, y, test_size=0.2): X_train, X_test, y_train, y_test = train_test_split(X, y, test_size=test_size, random_state=42) return X_train, X_test, y_train, y_test # Example usage: X = np.array([[1, 2], [1, 3], [2, 1], [6, 7], [7, 8], [8, 9]]) y = np.array([0, 0, 0, 1, 1, 1]) X_train, X_test, y_train, y_test = split_data(X, y) print(“X_train:”, X_train) print(“X_test:”, X_test) |
24. How would you detect outliers in a dataset?
Outliers can be detected using several methods, some of which are:
- Visualization: Methods such as box plots and scatter plots are used to detect the outliers. Outliers can be spotted visually by looking for points that are far away from the rest of the points in the dataset.
- Statistical methods: Methods such as Z-score and Interquartle Range (IQR) are used to detect outliers. A Z-score greater than 3 or less than -3 indicates an outlier. In IQR, values outside the range Q1 -1.5 x IQR and Q3 + 1.5 x IQR are considered outliers.
25. What are the main steps in exploratory data analysis (EDA)?
The main steps in Exploratory Data Analysis (EDA) are:
- Data Collection: Gather data from different sources, including structured, semi-structured, and unstructured data.
- Data Cleaning: Handle missing values, remove duplicates, correct inconsistencies, and fix errors.
- Data Transformation: Convert data types, normalize/scale data, and perform feature engineering.
- Descriptive Statistics: Calculate measures like mean, median, standard deviation, and correlations.
- Visualization: Create visualizations such as histograms, box plots, scatter plots, and heatmaps to identify patterns and relationships.
- Hypothesis Testing: Perform statistical tests to validate assumptions and draw inferences.
26. How can you merge two data frames in Python?
In pandas, you can merge two DataFrames using the merge() function, which allows you to combine DataFrames based on common columns or indices, similar to SQL joins.
| import pandas as pd df1 = pd.DataFrame({‘key’: [‘A’, ‘B’, ‘C’], ‘value’: [1, 2, 3]}) df2 = pd.DataFrame({‘key’: [‘B’, ‘C’, ‘D’], ‘value’: [4, 5, 6]}) merged_df = pd.merge(df1, df2, on=’key’, how=’inner’) print(merged_df) |
27. How can you handle missing data in pandas?
Pandas have several methods for handling missing data. Some of them are:
- Identifying missing data: isna() and isnull() functions in pandas are used to check for missing values in a dataset, which provides the number of null values present.
- Dropping missing values: To drop the missing values from the dataset, dropna() function is used to drop the rows or columns.
- Filling missing values: fillna() is used to replace the missing values with a specific value or method
28. What are the differences between R and Python in Data Science?
- R is particularly strong in statistical analysis and visualization, with a rich set of packages for these purposes.
- Python is more versatile and widely used for general-purpose programming and machine learning, with libraries like Pandas, NumPy, and Scikit-learn.
29. What is a ROC Curve?
A Receiver Operating Characteristic (ROC) Curve is a graphical representation of a classification model’s performance. It plots the True Positive Rate (TPR) against the False Positive Rate (FPR) at various threshold settings, helping to evaluate the trade-offs between sensitivity and specificity.
30. Implement a function to find the most frequent element in a list
| from collections import Counter def most_frequent_element(list): count = Counter(list) return count.most_common(1)[0][0] # Returns the most frequent element # Example usage: list = [1, 2, 3, 1, 2, 1] print(most_frequent_element(list)) # Output: 1 |
Conclusion
To ace your upcoming data science interview, you need to have a strong understanding of basic concepts in programming, maths, statistics, machine learning and data processing. By mastering these concepts, preparing the skills mentioned in the job description and frequently asked questions mentioned above, you can easily ace the interview. Happy Interviewing!
FAQs
Include a mix of projects that showcase your skills in data analysis, machine learning, and visualization. Highlight any end-to-end projects, from data cleaning to model deployment, and include links to your GitHub or personal website.
Use the STAR method (Situation, Task, Action, Result) to structure your responses to behavioral questions. For technical questions, clearly explain your thought process, the steps you took, and the reasoning behind your choices.
Stay calm and communicate your thought process. Explain what you’re trying to do, what assumptions you’re making, and where you think the issue might be. Interviewers appreciate seeing how you approach problem-solving.
Ask about the team structure, the types of projects you’d be working on, the company’s data culture, opportunities for growth, and the tools and technologies the team uses. This shows your interest and helps you gauge if the role is a good fit.






![Top 25 Business Analyst Interview Questions and Answers [2025] 10 feature image-Business Analyst Interview Questions With Answers](https://www.guvi.in/blog/wp-content/uploads/2023/07/feature-image-Business-Analyst-Interview-Questions-With-Answers.jpg)

![Top 20 RPA UiPath Interview Questions and Answers [2025] 12 rpa uipath interview questions](https://www.guvi.in/blog/wp-content/uploads/2023/02/Top-20-RPA-UiPath-Interview-Questions-and-Answers.png)


![Top 35 HTML and CSS Interview Questions with Answers [2025] 14 html and css interview questions with answers](https://www.guvi.in/blog/wp-content/uploads/2022/06/2.-HTML-Css.png)


Did you enjoy this article?