
Business Analytics Syllabus | A Complete Guide
Mar 11, 2025 6 Min Read 3728 Views
(Last Updated)
Imagine being the mastermind behind decisions that steer companies to success. Sounds cool, right? That’s exactly what business analytics is all about, taking raw data and turning it into actionable insights. If you’re planning to dive into this exciting world, knowing what the syllabus entails is your first move.
This guide is like your backstage pass to the world of business analytics. We’ll break down the syllabus, reveal the skills you’ll learn, and even sprinkle in tips to help you ace the game. So, whether you’re dreaming of becoming a data wizard or just curious about how businesses make smart moves, let’s get started!
Table of contents
- What Is Business Analytics?
- Who Should Learn Business Analytics?
- Looking Deeper into Business Analytics Syllabus
- Introduction to Business Analytics
- Core Statistical Concepts
- Data Analytics Tools
- Data Visualization
- Predictive Analytics and Machine Learning
- Database Management and Big Data
- Project Management and Agile Methodologies
- Soft Skills and Communication
- How to get Started
- Wrapping Up
- Frequently Asked Questions
- Is business analytics hard to learn?
- Is Business Analytics a rewarding career?
- Can a fresher become a business analyst?
What Is Business Analytics?
Business analytics is the practice of using data, both historical and real-time to uncover patterns, generate insights, and drive strategic decision-making. It’s where data science meets business intelligence, bridging the gap between complex datasets and actionable business strategies.
Who Should Learn Business Analytics?
This field is ideal for problem-solvers, analytical thinkers, and those passionate about technology and data. Whether you’re eyeing a career as a business analyst, data scientist, or consultant, Business Analytics provides a robust foundation for various roles.
By mastering business analytics, professionals gain the ability to turn numbers into narratives that drive growth and innovation. It’s not just about crunching numbers but about making them count.
Looking Deeper into Business Analytics Syllabus
Business Analytics is the driving force behind data-informed decision-making, combining statistics, technology, and business strategy to solve real-world challenges. Below is a detailed description of the various components of a Business Analytics curriculum:
1. Introduction to Business Analytics
The Introduction to Business Analytics section sets the stage by explaining how this field acts as a critical bridge between raw data and actionable business strategies. It highlights the significance of analytics in addressing complex business challenges by aligning organizational objectives with IT solutions. This segment delves into how business analytics transforms data into meaningful insights, enabling better decision-making and fostering innovation across industries.
This section emphasizes the multifaceted nature of business analytics, combining technical proficiency, strategic thinking, and interpersonal skills. Learners will understand the foundational concepts, appreciate the real-world relevance of analytics, and gain insights into career paths and essential competencies.
2. Core Statistical Concepts
Statistics is the backbone of business analytics, equipping learners with the tools needed to interpret data, uncover patterns, and make informed decisions. This section focuses on the essential statistical concepts that form the foundation of data-driven problem-solving, emphasizing their real-world applications and relevance in the business context. Let’s quickly see what’s included in this section:
Probability:
Understanding the likelihood of events and their implications in business scenarios, such as predicting customer purchases or assessing risks.
Descriptive Statistics:
Techniques to summarize and describe datasets using measures like mean, median, mode, and standard deviation. This helps in identifying trends and drawing initial insights from raw data.
Hypothesis Testing:
Learning how to validate assumptions and make data-driven decisions, such as determining the success of a marketing campaign or the effectiveness of a new product feature.
Regression Analysis:
Exploring relationships between variables to predict outcomes. For example, regression can help forecast sales based on advertising spend or seasonal trends.
Applications in Real-World Scenarios:
Learners will discover how these concepts apply to practical business problems, such as customer segmentation, inventory optimization, and performance measurement.
This section provides a hands-on understanding of statistical methods, emphasizing their use in deriving actionable insights from data. It prepares learners to tackle complex datasets and confidently approach analytical challenges, making it a cornerstone of any business analytics journey.
3. Data Analytics Tools
In the field of business analytics, mastering data tools is essential for extracting, manipulating, and analyzing data to uncover actionable insights. This section introduces learners to powerful tools and technologies, equipping them with hands-on experience to handle diverse datasets and solve real-world problems effectively.
Excel:
Learn foundational data manipulation techniques such as sorting, filtering, pivot tables, and basic statistical analysis. Excel serves as an accessible yet robust tool for quick data exploration and modeling.
Python and R:
Gain proficiency in advanced programming languages used for statistical modeling, machine learning, and automation. Learn libraries like Pandas, NumPy, and Matplotlib in Python for data manipulation and visualization, and R’s packages like ggplot2 for advanced analytics.
SQL (Structured Query Language):
Develop expertise in querying, extracting, and managing data from relational databases. Explore real-world applications of SQL, such as customer behavior tracking, sales performance analysis, and inventory optimization.
Exploratory Data Analysis (EDA):
Dive into EDA, a critical step in the analytics process, which involves summarizing and visualizing data to identify trends, patterns, and anomalies. Understand techniques for cleaning and preparing data for deeper analysis using the above tools.
By the end of this section, learners will have a solid command of essential data analytics tools, preparing them to manipulate raw data efficiently, create comprehensive visualizations, and uncover key insights that drive strategic decisions. This practical skill set is crucial for building confidence in tackling data challenges in any professional context
You might Like: Top 11 Business Analytics Courses and Certifications in India
4. Data Visualization
Data visualization is a vital component of business analytics, bridging the gap between raw data and impactful decision-making. It enables analysts to present complex datasets in visually compelling and easily digestible formats, allowing stakeholders to grasp trends, patterns, and anomalies at a glance. This section focuses on mastering industry-leading visualization tools and creating dashboards that turn insights into actions.
Learning Visualization Tools
Tableau:
Tableau is one of the most popular tools for interactive data visualization. Learners will explore its drag-and-drop interface to create stunning visualizations like bar charts, heatmaps, and geographic maps. Tableau’s ability to handle large datasets and integrate with multiple data sources makes it a go-to solution for creating dynamic dashboards.
Power BI:
Power BI, Microsoft’s robust business intelligence tool, is known for its seamless integration with Excel and other Microsoft products. In this segment, learners will dive into crafting detailed reports and dashboards using Power BI’s powerful DAX formulas, enabling them to generate insights from structured and unstructured data.
Practical Applications
Through hands-on projects, learners will apply these tools to real-world scenarios. For example, they might build dashboards to track sales performance, analyze customer feedback, or monitor supply chain efficiency. These skills prepare learners to support data-driven decision-making in retail and finance industries.
By the end of this module, learners will have the expertise to create insightful visualizations and dashboards, transforming raw data into a strategic asset for any organization.
5. Predictive Analytics and Machine Learning
Predictive analytics, combined with machine learning, is a cornerstone of modern business analytics, enabling organizations to forecast future outcomes and make proactive decisions. By analyzing historical and real-time data, predictive analytics identifies patterns and trends, while machine learning enhances this process with algorithms that learn and improve over time. This module equips learners with the tools and techniques needed to leverage predictive models effectively in a business context.
By mastering the techniques of predictive analytics, learners will be able to build and evaluate predictive models using tools like Python, R, and machine learning libraries such as sci-kit-learn and TensorFlow. They will gain hands-on experience in applying these models to real-world business challenges, ensuring they can drive data-driven decision-making in any organization.
This module prepares learners to harness the power of predictive analytics and machine learning, making them valuable assets in industries ranging from finance to healthcare, marketing, and beyond.
6. Database Management and Big Data
Effective data management is critical to business analytics, ensuring that organizations can store, organize, and analyze large datasets efficiently. This module focuses on building proficiency in database management systems and big data technologies, which are essential for handling the vast amount of information generated in today’s digital age.
By mastering these skills, learners will be equipped to:
- Handle structured and unstructured data efficiently.
- Extract meaningful insights from large-scale data using SQL and big data technologies.
- Implement scalable solutions for data storage and analysis in diverse industries like healthcare, finance, and logistics.
This module bridges the gap between traditional database management and advanced big data analytics, preparing learners for roles in data engineering, analytics, and beyond.
7. Project Management and Agile Methodologies
Business analytics projects demand a structured and adaptable approach to ensure timely delivery and stakeholder satisfaction. The integration of project management principles with Agile methodologies offers a powerful framework to achieve these objectives.
Upon completing this module, learners will be able to:
- Manage analytics projects effectively from inception to completion.
- Apply Agile principles to adapt to changing requirements and ensure client satisfaction.
- Collaborate with cross-functional teams to achieve project goals.
By combining project management principles with Agile methodologies, learners are equipped to tackle the dynamic demands of the business analytics field, ensuring impactful and efficient project delivery.
Also, read about the 6 Reasons Business Analytics Makes Digital Marketing Powerful
8. Soft Skills and Communication
In business analytics, technical expertise alone is not enough. The ability to effectively communicate complex insights to stakeholders, foster collaboration, and build strong interpersonal relationships is crucial. This section focuses on the development of soft skills that are just as important as technical skills in ensuring that analytics projects drive business value.
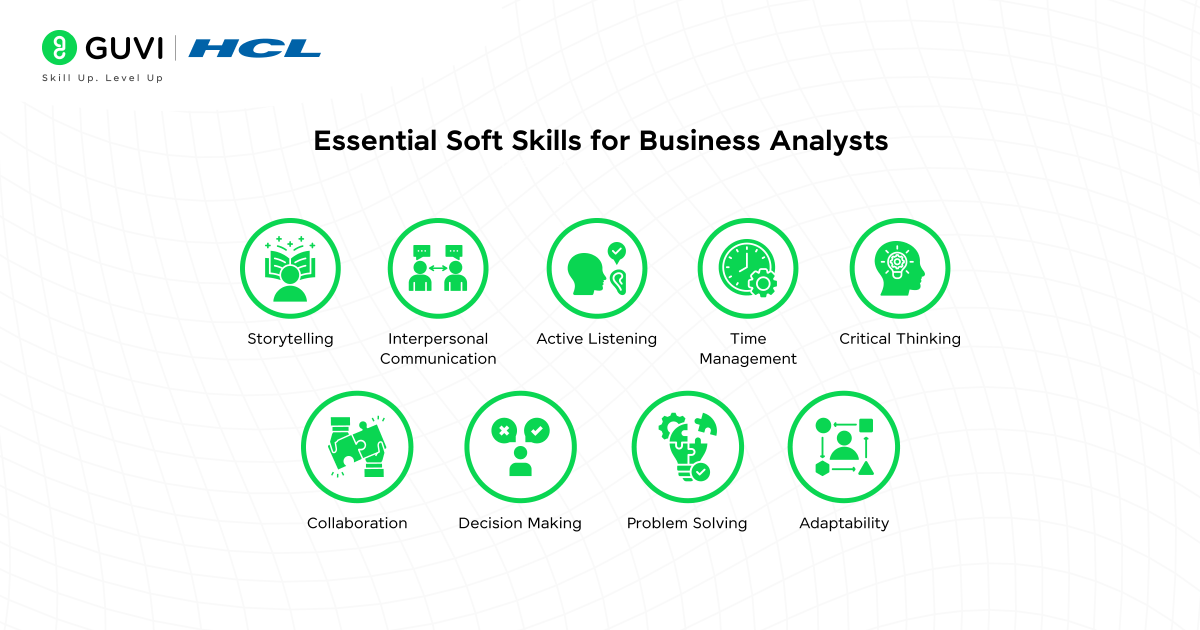
Learners will gain proficiency in:
Data storytelling:
Crafting a narrative around data insights to make them relatable and impactful for business leaders.
Visualization skills:
Using tools like Tableau and Power BI to create intuitive, easy-to-understand dashboards that present key data points.
Tailoring communication:
Understanding the audience’s needs and presenting data in a way that aligns with business objectives, whether that’s focusing on risk mitigation, performance improvement, or new opportunities.
Collaboration skills:
Building effective working relationships with diverse teams, managing cross-functional communication, and ensuring all voices are heard during decision-making.
Empathy in communication:
Putting oneself in the shoes of stakeholders and team members to understand their perspectives and needs, leads to more productive discussions and outcomes.
Negotiation skills:
Balancing differing priorities and expectations, especially when stakeholders have conflicting views. Analysts will learn how to negotiate compromises that keep projects on track and ensure business objectives are met.
Adaptability:
Learners will develop adaptability by working on real-time projects and participating in discussions about emerging trends in analytics, such as artificial intelligence and big data. This will foster a growth mindset, helping learners stay flexible and responsive in dynamic business environments.
These soft skills are critical in creating a positive work environment where teams are motivated, and objectives are met efficiently. They enable analysts to be trusted advisors, bridging the gap between data insights and business actions.
Read More: 10 Best Websites to Learn Business Analytics in India
How to get Started
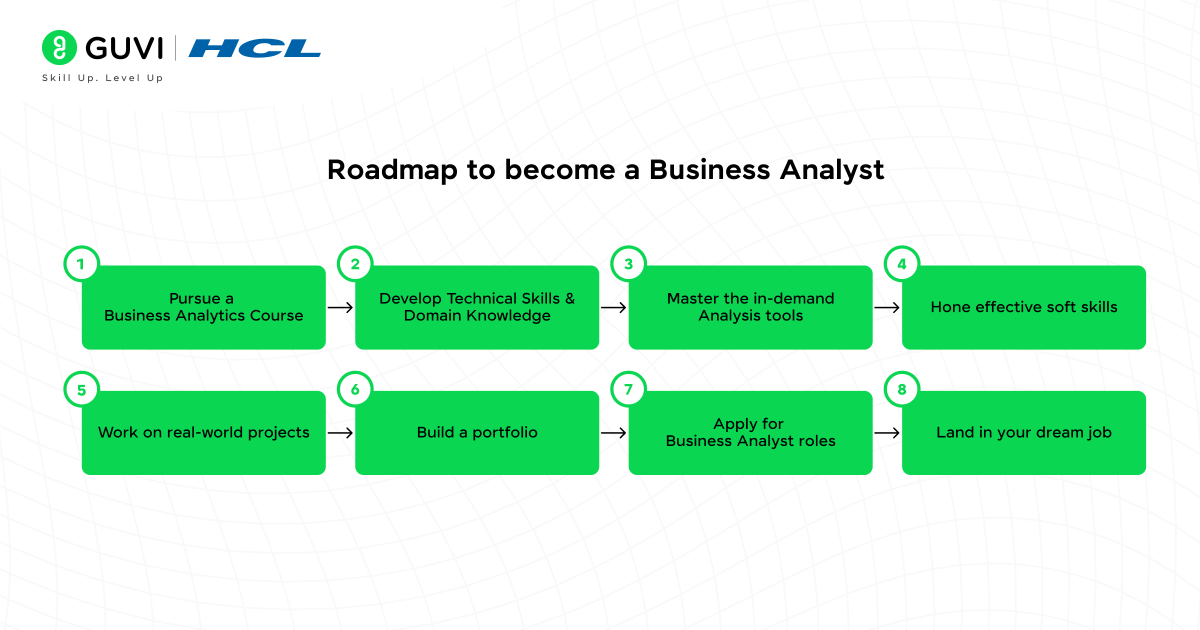
To get started with business analytics, one should follow the right steps of guidance. Here is a step-by-step guide on how to get started.
- Begin with Basics:
Start by mastering foundational tools like Excel for data manipulation and learning basic statistical concepts. This foundational knowledge forms the base for more advanced analytics skills.
- Learn Programming:
As you progress, transition to programming languages like Python or R for handling larger datasets, performing statistical analysis, and building machine learning models. These languages are powerful and widely used in the industry.
- Master Visualization tools
Develop skills in creating interactive dashboards using tools like Tableau or Power BI. These tools help translate complex data into actionable insights through clear visualizations, enhancing business decision-making.
- Understand Databases
Gain proficiency in SQL to write queries and manage relational databases. Additionally, familiarize yourself with big data tools like Hadoop and Spark to handle large datasets and perform more advanced analyses.
- Apply Your Knowledge
Reinforce your learning through real-world projects, case studies, or internships. Applying theoretical knowledge to practical situations is essential for deepening your understanding and building industry experience.
If you’re still stuck, Kickstart your career by enrolling in GUVI’s Business and Marketing Analytics Course where you will master technologies including Power BI, Excel, SQL, Tableau, and Data Visualization, and build interesting real-life business-analytics projects.
Alternatively, if you want to explore Marketing Research Techniques through a Self-paced course, try GUVI’s Marketing Research Techniques Self-Paced certification course.
Wrapping Up
To wrap things up, business analytics is your ticket to turning data into action and driving change in any industry. By mastering the right tools, developing key skills, and following a structured learning path, you’ll be on your way to becoming a data-driven problem solver who can help businesses thrive. Whether you’re crunching numbers with Excel, telling stories with Tableau, or predicting trends with machine learning, every step you take builds towards a future in one of the most exciting fields out there.
Frequently Asked Questions
Business analytics can seem challenging at first, but it becomes manageable with the right approach. It combines statistics, data analysis, and business insights, which may require time and practice to master. However, with consistent learning, hands-on experience, and the growing availability of resources (like online courses), it becomes easy to learn.
Yes, business analytics is a rewarding career. It offers high earning potential, with salaries for business analysts and data scientists typically on the rise due to the increasing demand for data-driven decision-making in businesses. Business analysts also enjoy diverse career opportunities, from data visualization and predictive analytics to strategy consulting. Moreover, the skills you gain in business analytics are transferable, making it a versatile and future-proof career choice.
Yes, a fresher can become a business analyst. Many entry-level roles are accessible with a solid understanding of business analytics tools (like Excel, SQL, and Tableau), basic statistical knowledge, and problem-solving skills. Freshers can also gain hands-on experience through internships, online courses, and certifications to build a strong foundation and stand out to employers.








Did you enjoy this article?