
9 Best Data Science Projects with Source Code
Jan 30, 2025 7 Min Read 9823 Views
(Last Updated)
In the dynamic world of information technology, data science stands as a beacon of innovation and insight, powering decisions across every industry.
Data science projects are at the heart of this revolution, which transforms raw data into actionable intelligence.
These projects leverage a range of tools and techniques, from feature engineering to data manipulation, using languages and frameworks such as Python, TensorFlow, and Scikit-learn, as well as platforms like GitHub for source code management.
As you go through this article, you’ll explore various data science projects, each illustrating the power of data analysis and model building to address specific challenges. I promise a comprehensive look at the practical application of data science in the real world.
Table of contents
- 1) COVID-19 Vaccination Progress
- 1) Overview
- 2) Tools and Technologies
- 3) Prerequisites
- 4) Step-by-Step Instructions
- 5) Expected Outcomes
- 2) Recommender System Using Amazon Reviews
- 1) Overview
- 2) Tools and Technologies
- 3) Prerequisites
- 4) Step-by-Step Instructions
- 5) Expected Outcomes
- 3) Price Prediction
- 1) Overview
- 2) Tools and Technologies
- 3) Prerequisites
- 4) Step-by-Step Instructions
- 5) Expected Outcomes
- 4) Fruit Image Classification
- 1) Overview
- 2) Tools and Technologies
- 3) Prerequisites
- 4) Step-by-Step Instructions
- 5) Expected Outcomes
- 5) Bank Customer Churn Prediction
- 1) Overview
- 2) Tools and Technologies
- 3) Prerequisites
- 4) Step-by-Step Instructions
- 5) Expected Outcomes
- 6) Twitter Sentiment Analysis
- 1) Overview
- 2) Tools and Technologies
- 3) Prerequisites
- 4) Step-by-Step Instructions
- 5) Expected Outcomes
- 7) Uber Data Analysis
- 1) Overview
- 2) Tools and Technologies
- 3) Prerequisites
- 4) Step-by-Step Instructions
- 5) Expected Outcomes
- 8) Customer Segmentation
- 1) Overview
- 2) Tools and Technologies
- 3) Prerequisites
- 4) Step-by-Step Instructions
- 5) Expected Outcomes
- 9) Climate Change Forecast
- 1) Overview
- 2) Tools and Technologies
- 3) Prerequisites
- 4) Step-by-Step Instructions
- 5) Expected Outcomes
- Concluding Thoughts...
- FAQs
- What are examples of data science projects?
- What are the 6 stages of a data science project?
- How to clean data in data science?
- What are big data uses?
1) COVID-19 Vaccination Progress
1.1) Overview
In an unprecedented scientific sprint, the global medical community developed multiple COVID-19 vaccines within a year, a process that typically spans five years.
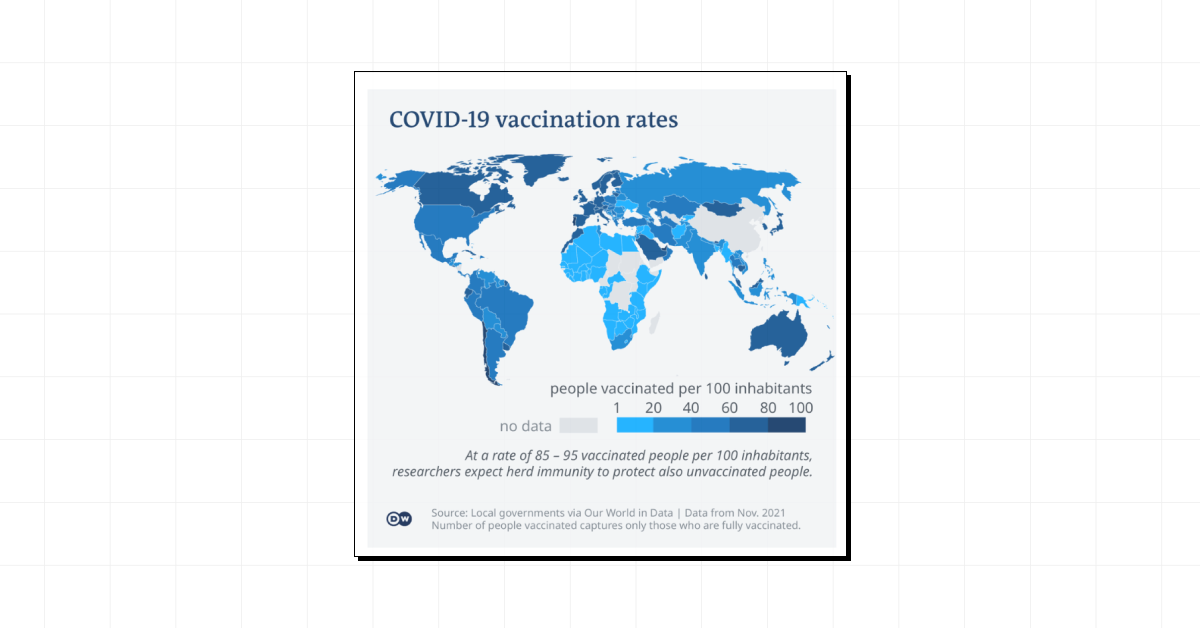
As of now, 13 vaccines have been authorized globally, with over 800 million doses administered, marking a historic achievement in combating the pandemic.
1.2) Tools and Technologies
- Data scientists have employed various Python libraries such as NumPy, Pandas, Matplotlib, Seaborn, and Plotly to perform exploratory data analysis (EDA) and visualize vaccination progress across different regions and demographics.
1.3) Prerequisites
- For those looking to delve into COVID-19 vaccination data analysis, familiarity with Python and basic libraries like Pandas for data manipulation, Matplotlib for plotting graphs, and Seaborn for statistical visualizations is essential.
- Access to vaccination data through platforms like GitHub where datasets are regularly updated is also crucial.
1.4) Step-by-Step Instructions
- Collect the latest COVID-19 vaccination data from reliable sources such as WHO or local government databases.
- Load the data using Pandas and perform initial data cleaning to handle missing values and outliers.
- Use Matplotlib and Seaborn to create visual representations of the data, such as vaccination rates per country or demographic.
- Analyze the trends and patterns to derive insights on vaccine efficacy and coverage.
1.5) Expected Outcomes
From this analysis, you can expect to gain insights into which demographics are showing higher vaccination rates, how vaccine distribution logistics are being handled, and the overall impact of vaccination on the pandemic’s trajectory. This can inform public health decisions and policy-making.
Source Code: COVID-19 Vaccination Progress
Before we move into the next section, ensure you have a good grip on data science essentials like Python, MongoDB, Pandas, NumPy, Tableau & PowerBI Data Methods. If you are looking for a detailed course on Data Science, you can join GUVI’s Data Science Course Program with Placement Assistance. You’ll also learn about the trending tools and technologies and work on some real-time projects.
Alternatively, if you would like to explore Python through a Self-paced course, try GUVI’s Python course.
2) Recommender System Using Amazon Reviews
2.1) Overview
Dive into the fascinating world of data science with the Recommender System Using Amazon Reviews. This data science project utilizes the Amazon Review Dataset, focusing on categories like clothes, shoes, jewelry, and beauty products.
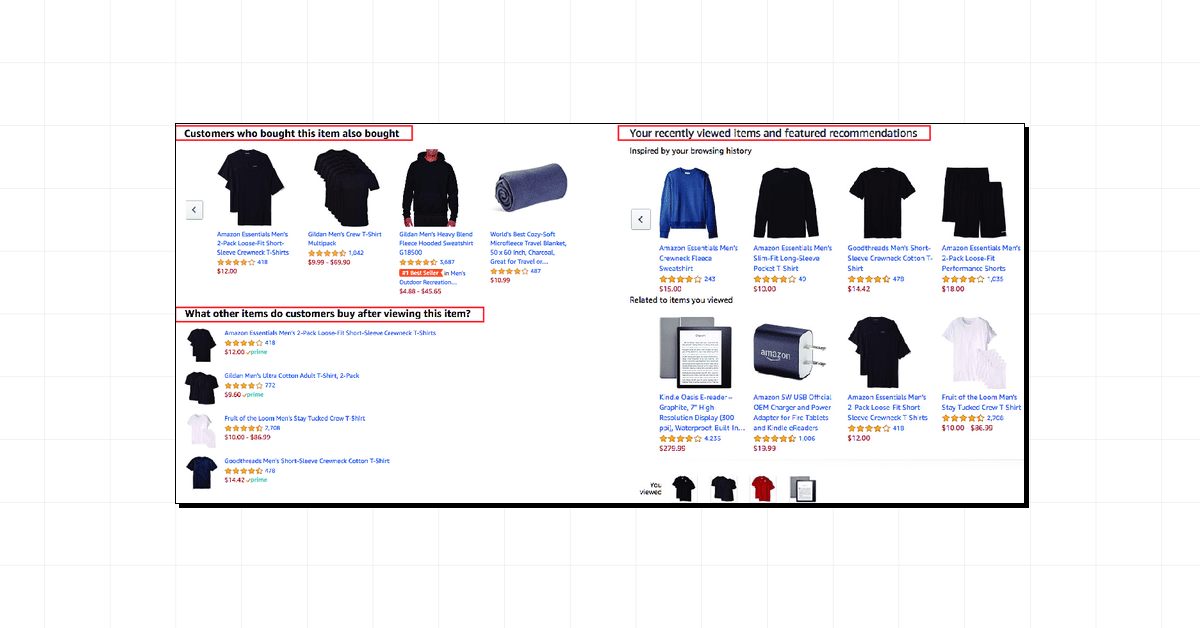
By analyzing user reviews and ratings, the system predicts the helpfulness of reviews and identifies similar items through sentiment analysis and collaborative filtering.
2.2) Tools and Technologies
- The data science project leverages Python and its powerful libraries including NumPy, Pandas, and Scikit-learn.
- For sentiment analysis, Natural Language Processing (NLP) techniques are employed to extract meaningful insights from the text.
- The item-based collaborative filtering model utilizes the k-Nearest Neighbors algorithm to find similarities between items.
2.3) Prerequisites
- To engage with this data science project, you should be familiar with Python and basic data manipulation libraries such as Pandas and NumPy.
- Understanding NLP and machine learning concepts, particularly k-Nearest Neighbors, is also crucial.
2.4) Step-by-Step Instructions
- Download the Amazon Review Dataset from the provided source.
- Use Pandas for data preprocessing, handling missing values and outliers.
- Apply NLP techniques to perform sentiment analysis on the reviews.
- Implement the k-Nearest Neighbors algorithm to establish item-based collaborative filtering.
- Analyze the output to determine the effectiveness of the recommendations.
2.5) Expected Outcomes
From this data science project, you can anticipate a deeper understanding of how recommender systems work. Expect to enhance your skills in data manipulation, sentiment analysis, and collaborative filtering, gaining insights into user behavior and preferences.
Source Code: Recommender System Using Amazon Reviews
3) Price Prediction
3.1) Overview
Dive into the dynamic world of price prediction across various sectors using machine learning and deep learning techniques.
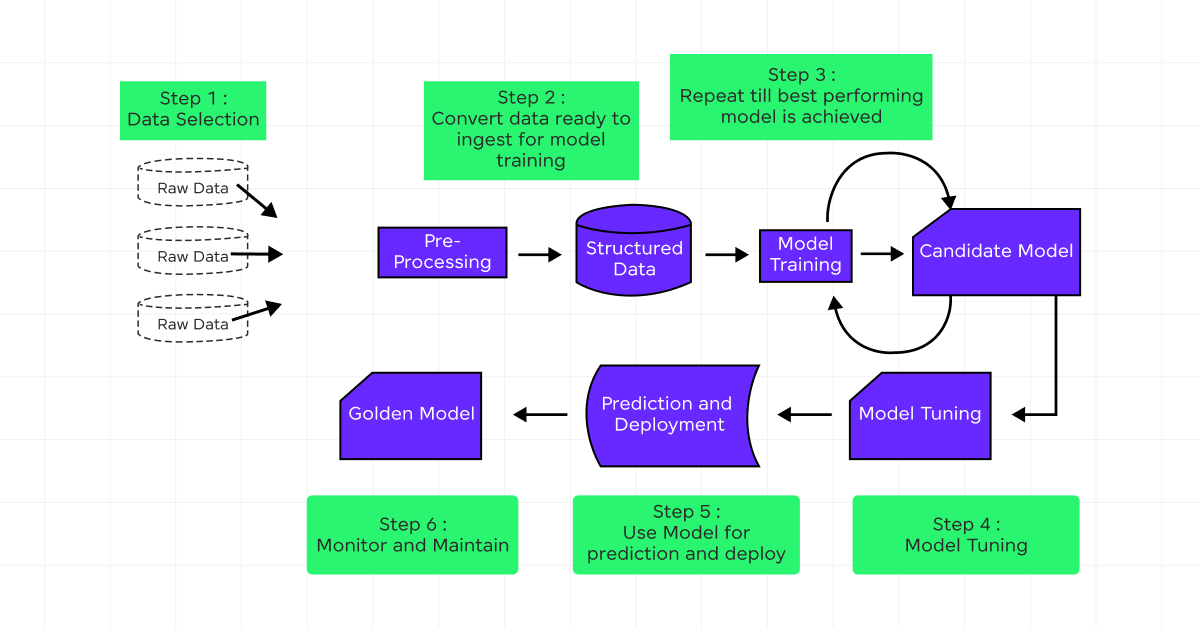
From cryptocurrency to real estate and stock markets, predictive models are developed to forecast future prices based on historical data and various market indicators.
This section explores several projects that apply different methodologies to predict prices in multiple domains.
3.2) Tools and Technologies
- Leverage a variety of tools and technologies in these projects, including Python, TensorFlow, Keras, and Scikit-learn.
- Utilize libraries like Pandas for data manipulation, Matplotlib for data visualization, and LSTM (Long Short-Term Memory) networks to handle time-series data effectively.
- The Prophet library, specifically, is highlighted for its robust time-series forecasting capabilities.
3.3) Prerequisites
- To engage with these price prediction projects, you should be familiar with basic programming in Python, understand machine learning concepts, and have a grasp of libraries like Pandas and NumPy.
- Knowledge of time-series analysis and experience with deep learning frameworks such as TensorFlow will enhance your ability to work on these projects.
3.4) Step-by-Step Instructions
- Collect historical price data from reliable sources.
- Preprocess the data to handle missing values and outliers.
- Choose and configure the appropriate machine learning model based on the prediction task.
- Train the model on the dataset and validate it using a separate test set.
- Evaluate the model’s performance using metrics like RMSE (Root Mean Squared Error) and visualize the predictions.
3.5) Expected Outcomes
Expect to gain insights into the accuracy of different predictive models and understand how various features influence price forecasts.
These projects typically aim to minimize prediction errors and provide reliable price forecasts that can aid in decision-making processes in real-world scenarios.
Source Code: Price Prediction
4) Fruit Image Classification
4.1) Overview
Fruit Image Classification is a critical application of machine learning that enhances efficiency in supermarkets and agricultural practices.
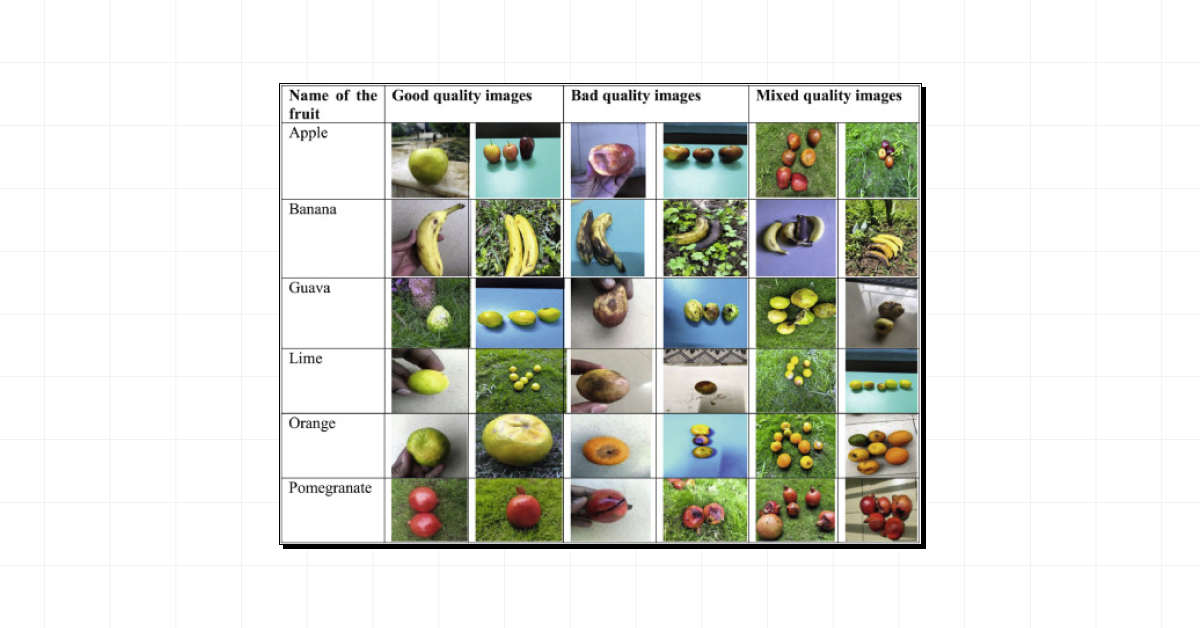
This data science project focuses on developing a convolutional neural network to classify various fruits such as apples, bananas, grapes, mangoes, and strawberries.
By automating the sorting process, this technology reduces human labor and minimizes the handling of produce, thus promoting better hygiene and reducing the spread of contaminants.
4.2) Tools and Technologies
- Utilize state-of-the-art technologies including TensorFlow and Keras for building and training the CNN model.
- The project leverages the Fruits 360 dataset, which comprises 10,000 images of different fruits captured under various conditions, providing a robust training environment for the model.
4.3) Prerequisites
- Before diving into this data science project, ensure you are equipped with a fundamental understanding of Python programming, data manipulation, and basic machine learning concepts.
- Familiarity with TensorFlow or Keras is crucial as these are the primary frameworks used for model development.
4.4) Step-by-Step Instructions
- Acquire the Fruits 360 dataset and divide it into training, validation, and testing sets.
- Preprocess the images to normalize and resize them for consistent input.
- Construct the CNN using TensorFlow or Keras, layering convolutional layers for feature extraction followed by dense layers for classification.
- Train the model on the training dataset while validating its accuracy using the validation set.
- Evaluate the model’s performance on the unseen test set to gauge its effectiveness in real-world scenarios.
4.5) Expected Outcomes
Anticipate a model that accurately classifies fruits, significantly aiding in their sorting and grading.
This system is expected to streamline operations in retail environments and agricultural settings, reducing errors and improving the overall quality of produce offered to consumers.
Source Code: Fruit Image Classification
5) Bank Customer Churn Prediction
5.1) Overview
Delve into the critical task of predicting bank customer churn, where the goal is to identify customers likely to leave a bank.
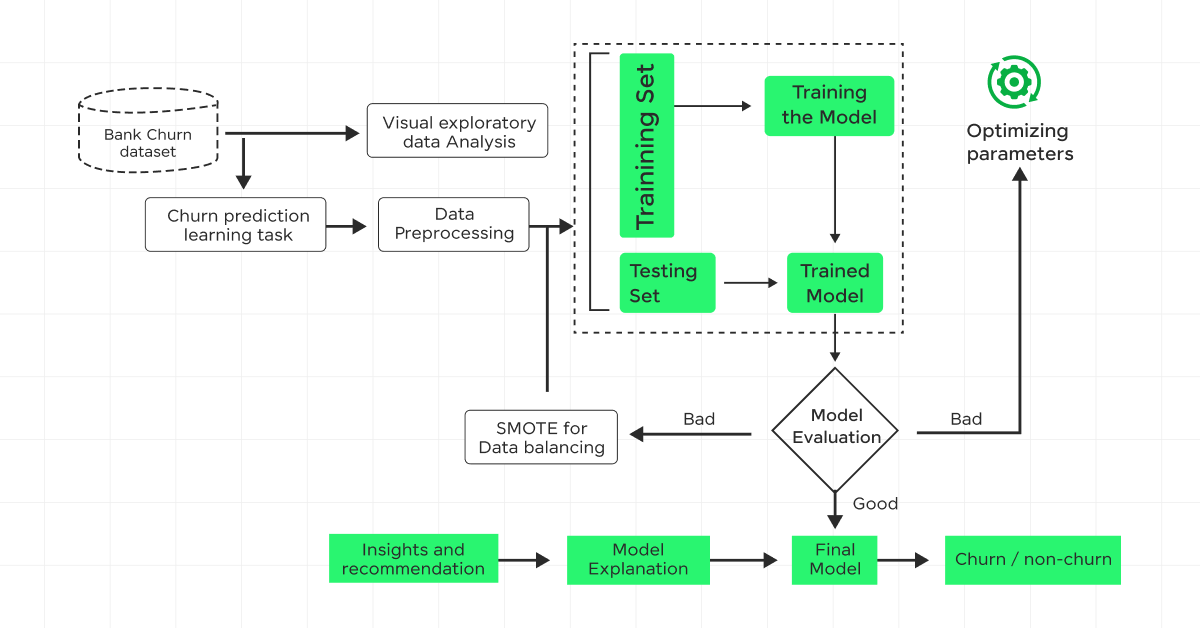
This data science project leverages a comprehensive dataset to develop a robust model capable of foreseeing customer attrition, thus enabling proactive measures to enhance customer retention and minimize revenue loss.
5.2) Tools and Technologies
- This data science project utilizes a variety of tools including Python, Jupyter, and advanced machine learning libraries such as Scikit-learn and XGBoost.
- Data visualization is handled through libraries like Matplotlib and Seaborn, providing clear insights into customer behaviors and churn patterns.
5.3) Prerequisites
- You should be familiar with Python and basic data manipulation tools like Pandas and NumPy.
- Knowledge of machine learning and data visualization tools and techniques is also crucial for engaging effectively with this data science project.
5.4) Step-by-Step Instructions
- Obtain the customer churn dataset.
- Conduct exploratory data analysis to understand the data and identify key patterns.
- Preprocess the data by handling missing values and normalizing features.
- Develop the model using algorithms like XGBoost and Random Forest.
- Evaluate the model using accuracy and F1-score metrics.
5.5) Expected Outcomes
Expect to achieve a model with high accuracy, potentially reaching an F1 score of 91%. This model will enable the prediction of churn probabilities, assisting banks in implementing effective retention strategies.
Source Code: Bank Customer Churn Prediction
6) Twitter Sentiment Analysis
6.1) Overview
Twitter sentiment analysis is a cutting-edge tool used to determine whether tweets about a specific topic are positive, negative, or neutral.
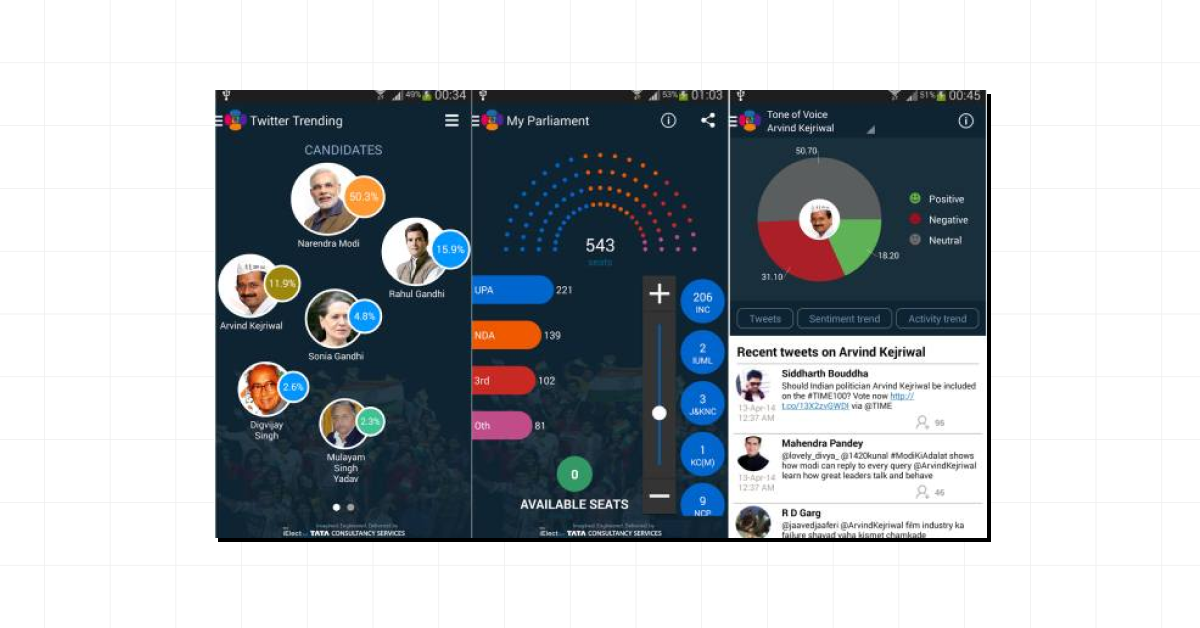
This technique is essential for gauging public opinion and can significantly impact marketing strategies and brand monitoring.
6.2) Tools and Technologies
- To conduct effective Twitter sentiment analysis, you’ll use Python libraries such as Tweepy for accessing the Twitter API and TextBlob for performing the sentiment analysis.
- Advanced machine learning models, including Logistic Regression, Bernoulli Naive Bayes, and SVM, are also utilized to classify sentiments accurately.
6.3) Prerequisites
- You should be comfortable with Python and have a basic understanding of Natural Language Processing (NLP) and machine learning concepts.
- Familiarity with the Twitter API and libraries like Tweepy and TextBlob will be crucial.
6.4) Step-by-Step Instructions
- Set up your environment by installing necessary Python libraries such as Tweepy and TextBlob.
- Authenticate with the Twitter API to fetch tweets.
- Clean and preprocess the tweets to remove noise.
- Analyze the tweets to classify them into positive, negative, or neutral categories using TextBlob.
- Optionally, refine your model with advanced classifiers like SVM or Logistic Regression for improved accuracy.
6.5) Expected Outcomes
By the end of your analysis, expect to have a clearer picture of the public sentiment surrounding your topic of interest.
This insight can help tailor marketing campaigns, improve customer interactions, and monitor brand health.
Source Code: Twitter Sentiment Analysis
7) Uber Data Analysis
7.1) Overview
Uber’s data science initiatives are pivotal in enhancing user experiences and optimizing operational efficiency.
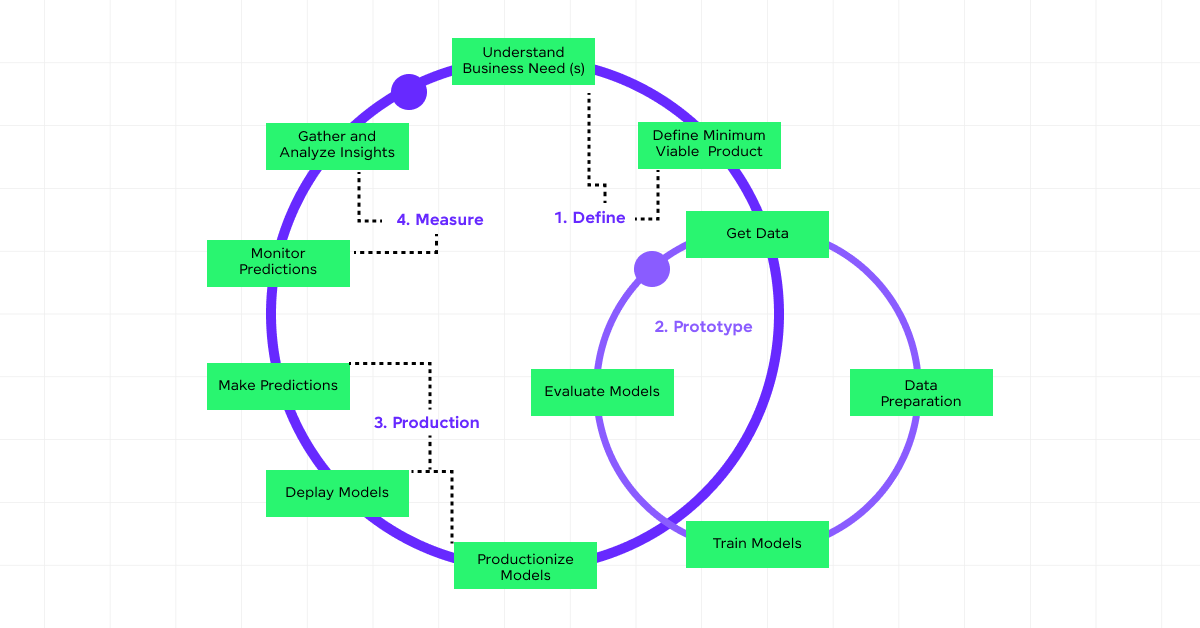
By leveraging advanced analytics and machine learning, Uber accurately predicts travel times, adjusts pricing dynamically, and optimizes route planning.
This seamless integration of data-driven strategies ensures that both drivers and riders have a reliable and efficient service.
7.2) Tools and Technologies
- Uber extensively uses Python for its data science projects, with libraries like NumPy, SciPy, Pandas, and Matplotlib being crucial for data manipulation and visualization.
- For real-time data processing and predictive modeling, Uber employs machine learning algorithms and frameworks such as TensorFlow and Scikit-learn.
- The data visualization tool of choice is D3, while Postgres serves as the primary SQL framework.
7.3) Prerequisites
- To dive into Uber’s data analysis, you should be proficient in Python and familiar with data science libraries like Pandas and NumPy.
- Understanding of basic machine learning concepts and experience with SQL databases, particularly Postgres, is also essential.
7.4) Step-by-Step Instructions
- Gather data from Uber’s diverse datasets, focusing on variables like travel times, pricing, and route information.
- Clean and preprocess the data using Pandas to handle missing values and normalize data formats.
- Employ statistical analysis and machine learning models to predict outcomes such as fare prices and arrival times.
- Visualize the results using Matplotlib and D3 to interpret the data effectively and make informed decisions.
7.5) Expected Outcomes
From this analysis, expect to gain insights into key operational metrics such as optimal pricing strategies, efficient routing, and improved prediction of travel times.
These outcomes not only enhance customer satisfaction but also boost operational efficiency.
Source Code: Uber Data Analysis
8) Customer Segmentation
8.1) Overview
Customer segmentation involves categorizing your clientele into distinct groups based on shared characteristics, enhancing targeted marketing and service delivery.
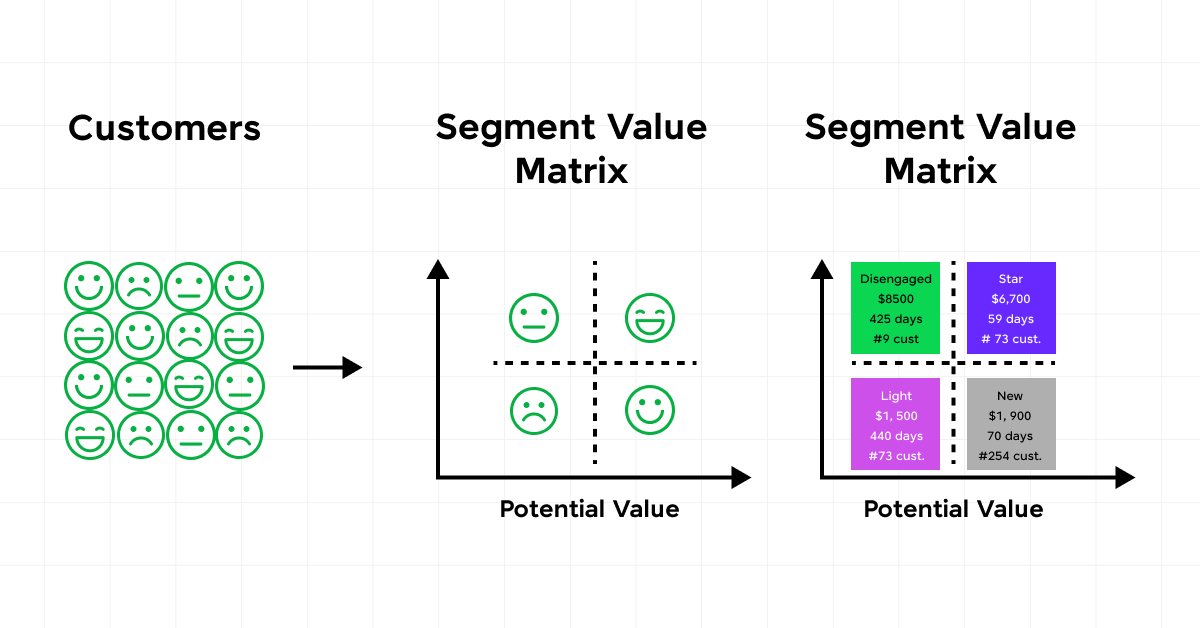
This process utilizes data science methods to identify patterns in customer behavior and preferences, which are crucial for crafting personalized experiences and strategic business decisions.
By understanding the various segments, you can tailor your products and services to meet the specific needs of different customer groups effectively.
8.2) Tools and Technologies
- To execute customer segmentation effectively, you’ll employ a range of tools and technologies. Python, along with libraries like Pandas for data manipulation and Scikit-learn for machine learning, plays a pivotal role.
- The K-Means clustering algorithm is commonly used for creating distinct customer groups based on data similarities.
- Additionally, visualization tools such as Matplotlib or Seaborn are essential for interpreting the clusters and understanding the segmentation landscape.
8.3) Prerequisites
- Before diving into customer segmentation, ensure you are equipped with basic knowledge of Python and familiarity with key libraries like Pandas and Matplotlib.
- Understanding unsupervised machine learning, specifically, clustering techniques such as K-Means and hierarchical clustering is also crucial as these form the backbone of most segmentation models.
8.4) Step-by-Step Instructions
- Data Collection: Gather customer data from various sources, ensuring it includes key variables like purchase behavior and demographics.
- Data Preparation: Clean the data to handle missing values and outliers, and normalize the data if necessary.
- Model Building: Implement the K-Means clustering algorithm to segment the customer data into distinct groups.
- Evaluation: Use silhouette scores to assess the effectiveness of your clustering model, ensuring that the segments created are well-defined and meaningful.
- Interpretation: Analyze and visualize the data clusters to understand the characteristics of each customer segment.
8.5) Expected Outcomes
From this segmentation, expect to achieve a clear delineation of customer groups, each with defined characteristics that allow for targeted marketing strategies and personalized customer interactions.
These insights will enable you to optimize resource allocation and enhance customer satisfaction by addressing the specific needs and preferences of different segments.
Source Code: Customer Segmentation
9) Climate Change Forecast
9.1) Overview
Climate change is an escalating concern with predictions indicating significant alterations in global climate patterns.
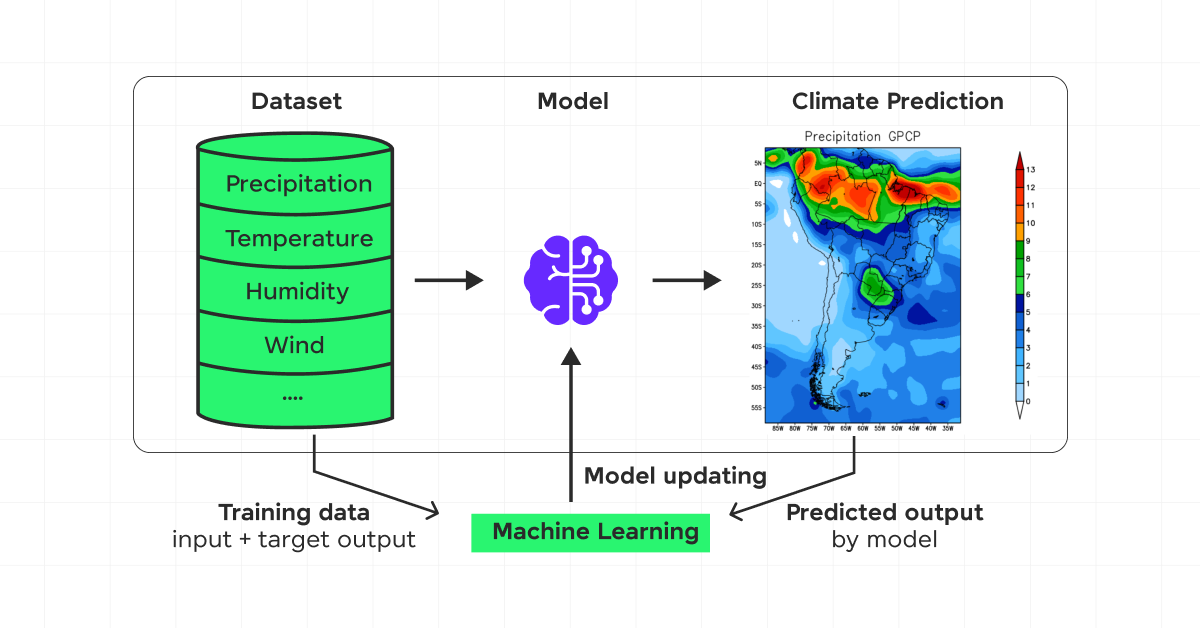
Continued greenhouse gas emissions are expected to lead to a warmer atmosphere, higher sea levels, and changes in precipitation patterns.
The extent of these changes hinges on current actions to curb emissions, with potential temperature increases ranging from 0.5°F to 8.6°F by 2100.
9.2) Tools and Technologies
- To analyze and predict climate trends, various tools and technologies are employed. Climate models, or General Circulation Models (GCMs), play a pivotal role.
- These models use mathematical equations to simulate interactions within the climate system across the atmosphere, oceans, and land.
9.3) Prerequisites
- Engaging with climate forecasting models requires a foundational understanding of environmental science and familiarity with modeling software.
- Skills in data analysis and interpretation are crucial to effectively utilize climate data for predictions.
9.4) Step-by-Step Instructions
- Data Collection: Gather historical climate data from reputable sources.
- Model Setup: Configure the climate model with initial parameters based on pre-industrial conditions.
- Run Simulations: Perform simulations to predict future climate scenarios under various greenhouse gas concentration trajectories.
- Analyze Results: Compare model outputs with historical data to validate the model’s accuracy.
9.5) Expected Outcomes
From these models, expect to gain insights into future climate conditions, including temperature rises, precipitation changes, and sea level increases.
These predictions help in planning and implementing strategies for mitigation and adaptation. These resources offer extensive data and findings on climate projections and impacts.
Source Code: Climate Change Forecast
Kickstart your Data Science journey by enrolling in GUVI’s Data Science Course where you will master technologies like MongoDB, Tableau, PowerBI, Pandas, etc., and build interesting real-life projects.
Concluding Thoughts…
Throughout this article, we’ve ventured deep into the realm of data science, exploring a variety of projects that harness Python, TensorFlow, and other powerful tools and technologies to analyze data, predict outcomes, and provide invaluable insights.
From tracking the global progress of COVID-19 vaccinations to forecasting market prices and beyond, each project illuminated the process of transforming data into actionable intelligence.
By diving into these projects, including their methodologies, tools, and expected outcomes, we’ve underscored the pivotal role that data science plays across diverse sectors, offering a window into the technical finesse required to navigate and leverage the data landscape effectively.
These data science projects exemplify the fusion of theory and application, showcasing the potential to influence decision-making, inform policy, and drive innovation.
FAQs
Examples of data science projects include customer segmentation, predictive maintenance, sentiment analysis, recommendation systems, fraud detection, and sales forecasting.
The six stages of a data science project are: 1) Problem Definition, 2) Data Collection, 3) Data Cleaning, 4) Data Exploration and Analysis, 5) Modeling, and 6) Deployment and Maintenance.
Data cleaning in data science involves removing duplicates, handling missing values, correcting errors, filtering out irrelevant data, and standardizing formats.
Big data is used in various fields such as healthcare for predictive analytics, finance for fraud detection, retail for personalized marketing, and logistics for optimizing supply chains.





![Top 12 Best Web Development Projects for All Techies [With Source Code] 11 web development project](https://www.guvi.in/blog/wp-content/uploads/2023/08/web-development-project.webp)


![Top 10 Coding Project Ideas for Beginners [With Source Code] 13 coding project](https://www.guvi.in/blog/wp-content/uploads/2024/05/Top-10-Coding-Project-Ideas-for-Beginners-With-Source-Code.webp)
![Top 9 Electronic Projects for Engineering Students [With Source Code] 14 Feature Image - Top Cutting-Edge Electronic Projects for Engineering Students](https://www.guvi.in/blog/wp-content/uploads/2024/05/Top-9-Electronic-Projects-for-Engineering-Students-With-Source-Code.webp)
![Best Project Ideas for Robotic Applications - Including All 3 Levels [2025] 15 Feature image - Best Project Ideas for Robotic Applications - Including All 3 Levels](https://www.guvi.in/blog/wp-content/uploads/2024/02/0-project_ideas_for_robotic_applications.webp)


Did you enjoy this article?