
In data science, having the right tools is important. One such tool that has gained importance is R. Originally developed for statistical computing, R has grown into a versatile and powerful language for data analysis, visualization, and machine learning. Learning R can significantly boost your capabilities and open up new possibilities.
In this blog, we will provide you with a thorough understanding of R for data science and its applications in data science. We will cover everything you need to know to learn R. Let’s begin!
Table of contents
- What is R?
- R for Data Science
- Getting Started with R
- Data Manipulation and Cleaning
- Exploratory Data Analysis (EDA)
- Statistical Analysis
- Machine Learning with R
- Best Practices
- Conclusion
- FAQs
- What are the main advantages of using R for data science?
- How do I get started with R for data science?
- Can R handle big data, and how does it integrate with other big data tools?
What is R?
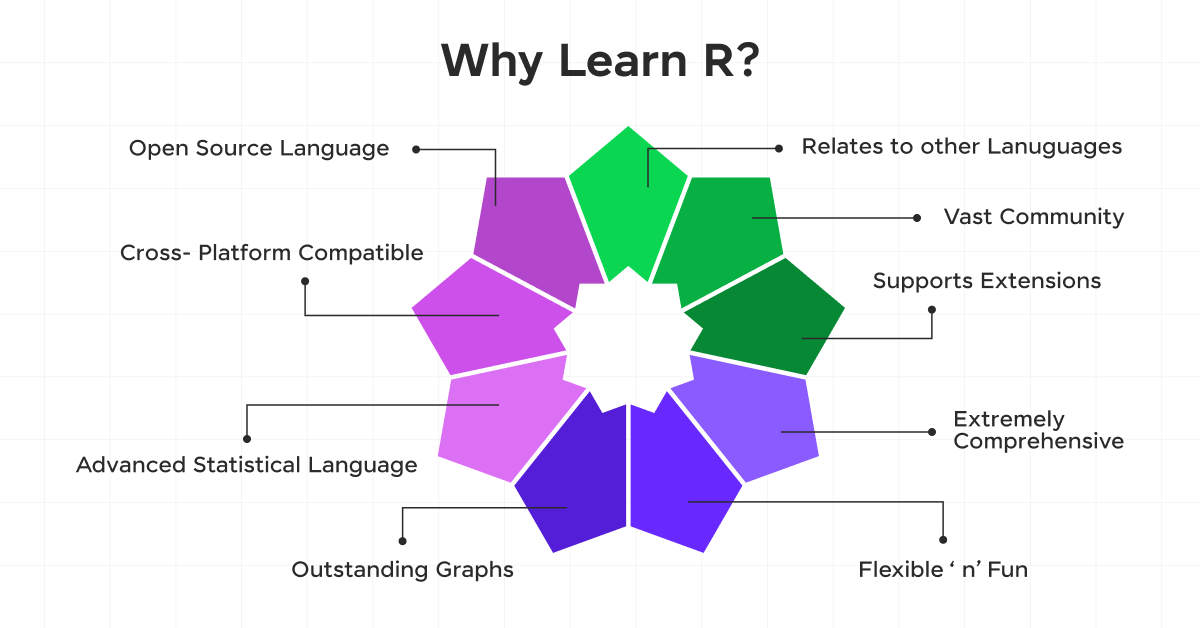
R is a programming language and software environment primarily designed for statistical computing, data analysis, and graphical visualization. Here are some key points about R:
- Open-source: R is freely available and has a large community of users and contributors.
- Statistical focus: It’s particularly well-suited for statistical analysis, data mining, and machine learning tasks.
- Graphical capabilities: R has powerful tools for creating various types of plots and visualizations.
- Extensibility: It has a vast ecosystem of user-contributed packages that extend its functionality.
- Interactive environment: R provides an interactive command-line interface for data exploration and analysis.
- Cross-platform: It runs on various operating systems, including Windows, macOS, and Linux.
- Integration: R can be integrated with other languages and tools, making it versatile for data science workflows.
- Used in academia and industry: It’s popular in fields such as statistics, bioinformatics, finance, and social sciences.
Before we move into the next section, ensure you have a good grip on data science essentials like Python, MongoDB, Pandas, NumPy, Tableau & PowerBI Data Methods. If you are looking for a detailed course on Data Science, you can join GUVI’s Data Science Course with Placement Assistance. You’ll also learn about the trending tools and technologies and work on some real-time projects.
Additionally, if you want to explore data science using R, try GUVI’s Data Science with R.
Now that we understand what R is, let’s learn how it is used in data science.
R for Data Science
Let’s explore the essentials of using R for data science, from getting started to advanced topics and best practices.
1. Getting Started with R
R is one of the best open-source programming languages and software environments primarily designed for statistical computing and graphical visualization. Its popularity in the data science community stems from its flexibility, extensive package ecosystem, and robust statistical capabilities.
Installing R and RStudio
To begin your journey with R, you’ll need to install two key components:
- R: The core language and runtime environment.
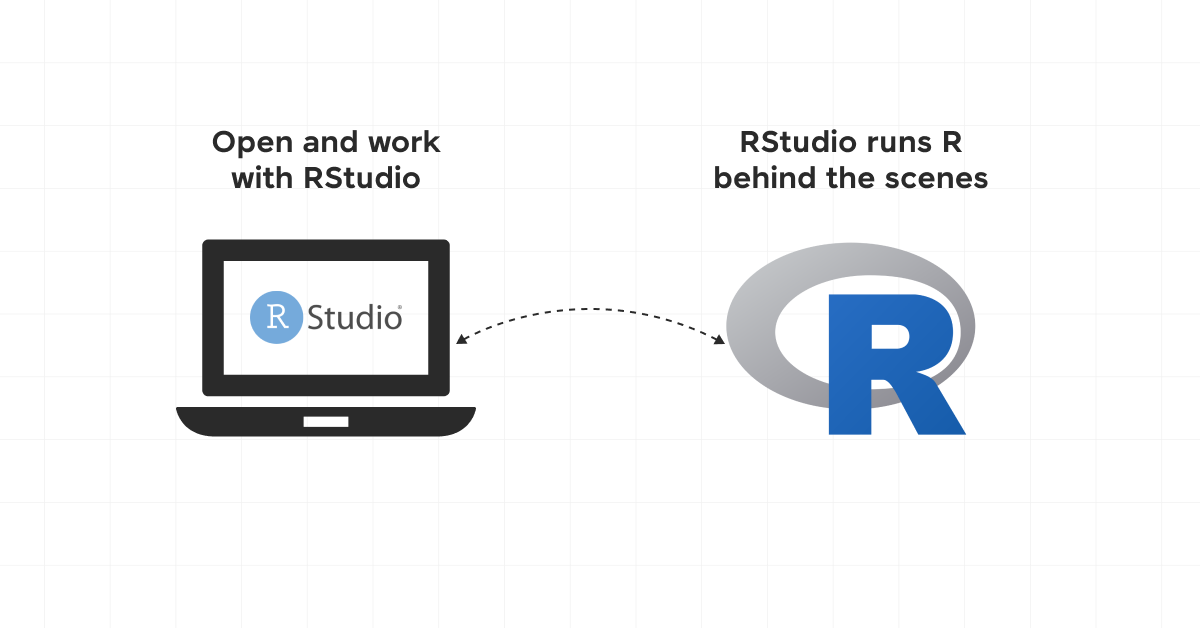
- RStudio: An integrated development environment (IDE) that makes working with R more efficient and user-friendly.
Also Read: Top 6 Programming Languages For AI Development
To install R:
- Visit the official R project website.
- Choose your operating system and follow the installation instructions.
To install RStudio:
- Go to the RStudio website.
- Download the free version of RStudio Desktop.
- Install it following the provided instructions.
R Environment
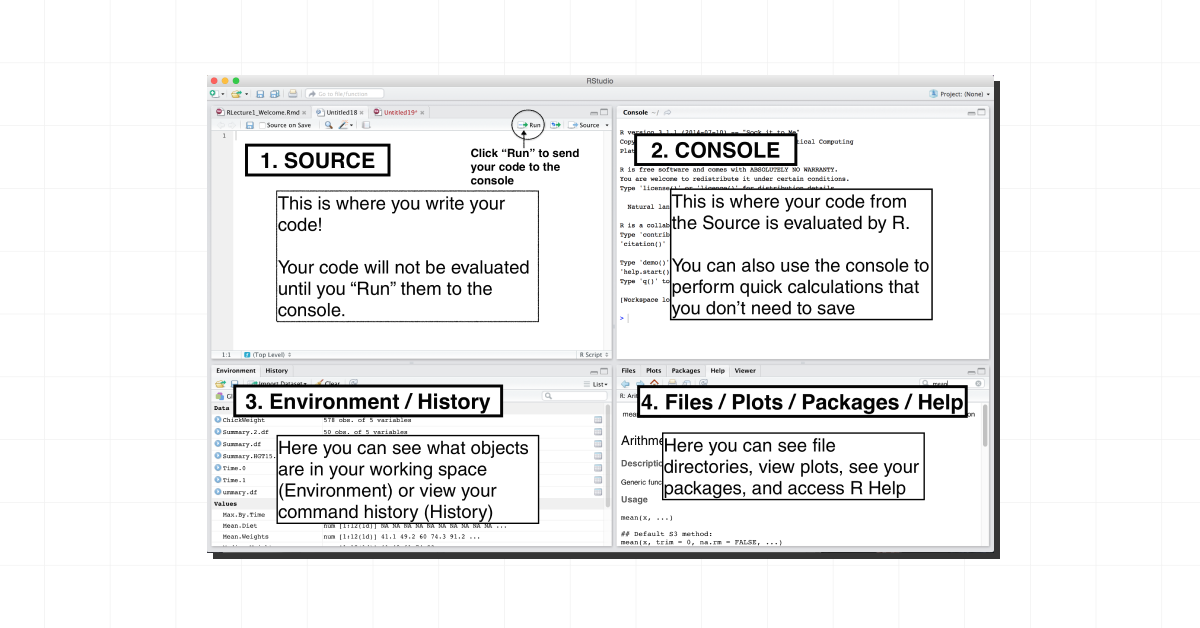
Once you have R and RStudio installed, familiarize yourself with the RStudio interface:
- Console: Where you can type R commands and see their output.
- Source Editor: For writing and editing R scripts.
- Environment: Displays the objects in your current R session.
- Files/Plots/Packages/Help: Provides access to files, graphical output, package management, and documentation.
Basic R Syntax
R has a straightforward syntax. Here are some fundamental concepts:
1. Variables and Assignment
x <- 5  # Assigns the value 5 to x

y = 10  # Alternative assignment operator
2. Data Types
- Numeric: 3.14
- Integer: 42L
- Character: “Hello, World!”
- Logical: TRUE or FALSE
3. Vectors
numbers <- c(1, 2, 3, 4, 5)4. Functions
mean(numbers) # Calculates the average of the vector5. Packages
install.packages("dplyr")  # Installs the dplyr package

library(dplyr)  # Loads the dplyr package
Getting Help in R
R has extensive built-in documentation. You can access help for any function using the ? operator:
?mean # Opens the help page for the mean functionAdditionally, the RStudio Help pane and online resources like Stack Overflow and R-bloggers are invaluable for learning and problem-solving.
With these basics, you’re ready to start your journey into data science with R. In the next section, we’ll explore data manipulation and cleaning, important skills for any data scientist.
2. Data Manipulation and Cleaning
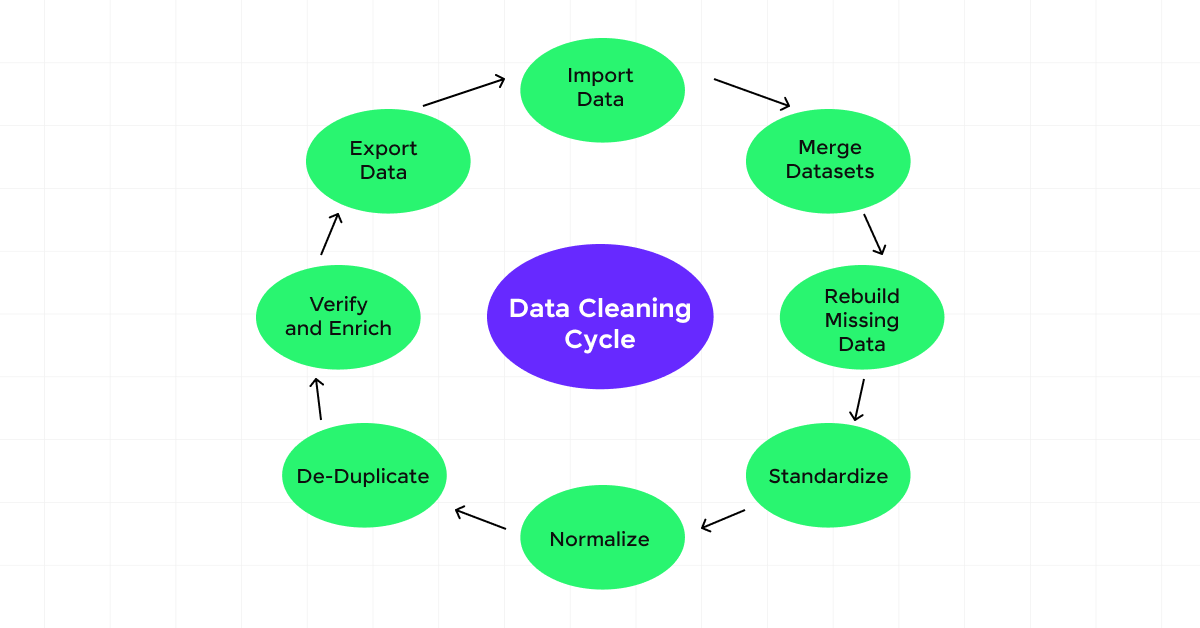
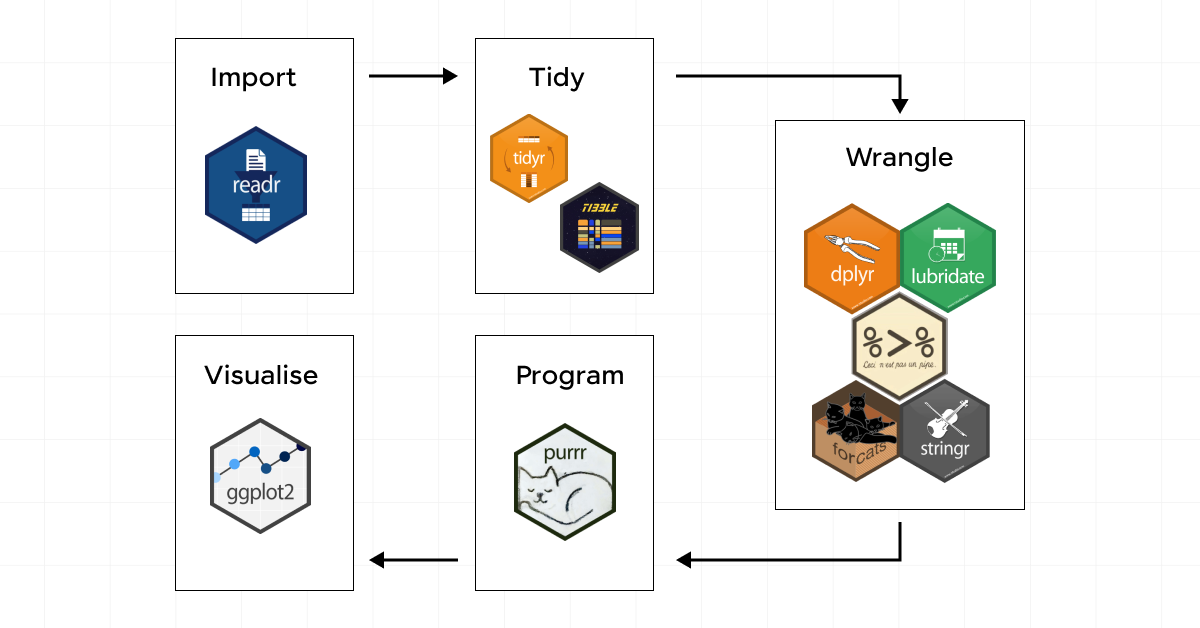
Data rarely comes in a perfect, analysis-ready format. A significant part of a data scientist’s job involves data preparing and data cleaning. R provides powerful tools for these tasks, with the tidyverse collection of packages being particularly useful.
Tidyverse
The tidyverse is a collection of R packages designed for data science. The core tidyverse includes packages like dplyr, tidyr, and ggplot2.
To get started, install and load the tidyverse:
install.packages("tidyverse")

library(tidyverse)
Reading Data into R
Before we can manipulate data, we need to import it. R can handle various file formats:
1. CSV files
data <- read_csv("your_file.csv")2. Excel files
library(readxl)

data <- read_excel("your_file.xlsx")
3. JSON files
library(jsonlite)

data <- fromJSON("your_file.json")
Data Manipulation with dplyr
dplyr provides a set of functions for efficient data manipulation:
1. select(): Choose specific columns
select(data, column1, column2)2. filter(): Subset rows based on conditions
filter(data, column1 > 5)3. mutate(): Create new columns or modify existing ones
mutate(data, new_column = column1 * 2)4. summarize(): Compute summary statistics
summarize(data, mean_value = mean(column1))5. group_by(): Group data for operations
data %>%

  group_by(category) %>%

  summarize(mean_value = mean(column1))
6. arrange(): Sort data
arrange(data, desc(column1))Data Cleaning with tidyr
tidyr helps in creating tidy data, where each variable is a column, each observation is a row, and each type of observational unit is a table.
1. pivot_longer(): Convert wide data to long format
pivot_longer(data, cols = c(col1, col2), names_to = "variable", values_to = "value")2. pivot_wider(): Convert long data to a wide format
pivot_wider(data, names_from = variable, values_from = value)3. separate(): Split a column into multiple columns
separate(data, col = full_name, into = c("first_name", "last_name"), sep = " ")4. unite(): Combine multiple columns into one
unite(data, col = "full_name", c("first_name", "last_name"), sep = " ")Also Read: 10 Hardest and Easiest Programming Languages
Handling Missing Data
Missing data is a common issue in real-world datasets. R provides several ways to handle it:
1. Identifying missing values
is.na(data)

sum(is.na(data))
2. Removing rows with missing values
na.omit(data)3. Imputing missing values
library(mice)

imputed_data <- mice(data, m=5, maxit = 50, method = 'pmm', seed = 500)

completed_data <- complete(imputed_data, 1)
Exporting Processed Data
After manipulation and cleaning, you might want to save your processed data:
write_csv(mtcars_processed, "processed_mtcars.csv")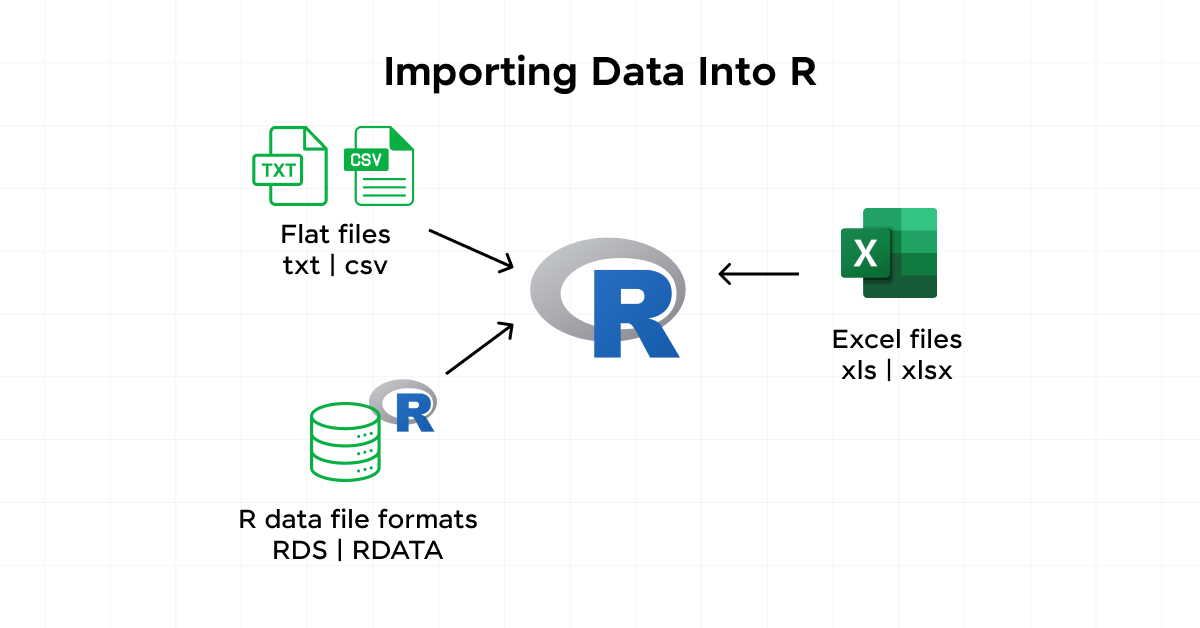
Data manipulation and cleaning are important skills in data science. With these tools from the tidyverse, you can efficiently prepare your data for analysis. In the next section, we’ll explore how to gain insights from your cleaned data through Exploratory Data Analysis (EDA).
3. Exploratory Data Analysis (EDA)
Exploratory Data Analysis (EDA) is a critical step in the data science process. It involves summarizing, visualizing, and understanding the main characteristics of your dataset. EDA helps you uncover patterns, spot anomalies, test hypotheses, and check assumptions. In R, we have powerful tools for EDA, particularly within the tidyverse ecosystem.
Data Visualization with ggplot2
ggplot2 is a powerful and flexible package for creating static graphics. It’s based on the Grammar of Graphics, which allows you to build plots layer by layer with the help of:
- Scatter plot
- Histogram
- Box plot
- Bar plot
- Correlation heatmap
Exploring Relationships
EDA often involves exploring relationships between variables with the help of:
- Correlation analysis
- Scatterplot matrix
- Faceting in ggplot2
Identifying Outliers and Anomalies
Outliers can significantly impact your analysis. Here are some ways to identify them:
- Box plots
- Z-score method
- IQR method
Exploratory Data Analysis is an important step in understanding your data before moving on to more complex analyses or modeling. It helps you identify patterns, relationships, and potential issues in your data. The insights gained from EDA often guide the direction of your subsequent analysis and modeling efforts.
In the next section, we’ll explore statistical analysis, where we’ll use the insights gained from EDA to formulate and test hypotheses about our data.
4. Statistical Analysis
Statistical analysis is a fundamental component of data science, allowing us to draw meaningful conclusions from data, test hypotheses, and make predictions. R provides a rich set of tools for various statistical techniques, from basic descriptive statistics to advanced inferential methods.
Hypothesis testing is important for inferential statistics, which can be done with the help of:
- t-test
- ANOVA
- Chi-square test
Statistical analysis in R provides a robust framework for drawing insights from data. From basic descriptive statistics to advanced techniques like Bayesian analysis and bootstrapping, R offers the tools needed to conduct thorough and rigorous statistical investigations.
In the next section, we’ll explore how to use R for machine learning tasks, building upon the statistical foundations we’ve covered here.
5. Machine Learning with R
Machine Learning (ML) is an important aspect of modern data science, allowing us to build predictive models and uncover complex patterns in data. R provides a rich ecosystem for machine learning, from data preprocessing to model evaluation and deployment.
Data Preprocessing for Machine Learning
Before building ML models, it’s essential to prepare your data with the help of techniques like:
- Handling missing values
- Feature scaling
- Encoding categorical variables
- Feature selection
Supervised Learning
Supervised learning involves predicting a target variable based on input features with the help of:
1. Linear Regression
2. Logistic Regression
3. Decision Trees
4. Random Forest
5. Support Vector Machines (SVM)
6. XGBoost
Unsupervised Learning
Unsupervised learning finds patterns in data without predefined target variables with the help of:
- K-means Clustering
- Hierarchical Clustering
- Principal Component Analysis (PCA)
Model Evaluation and Selection
Proper evaluation is important for building reliable ML models, which can be done with the help of the following:
- Train-Test Split
- Cross-Validation
- Performance Metrics
- ROC Curve (for classification)
Ensemble Methods
Combining multiple models can often lead to better predictions, which can be done with the help of:
- Bagging
- Boosting
- Stacking
Machine Learning in R offers a wide range of tools and techniques for building predictive models and uncovering patterns in data. From classic algorithms like linear regression to advanced ensemble methods and interpretability techniques, R provides a comprehensive ecosystem for ML tasks.
In the final section, we’ll discuss best practices for R programming.
7. Best Practices
As you advance in your R data science journey, adopting best practices becomes important. This section will cover some key best practices in R programming.
i) Code Style and Formatting
- Follow a consistent style guide, such as the tidyverse style guide.
- Use meaningful variable and function names.
- Indent your code properly for readability.
- Use the styler package to automatically format your code:
library(styler)

style_file("my_script.R")
ii) Code Organization
- Break your code into modular functions.
- Use scripts for analysis and functions for reusable code.
- Consider organizing your project using the ProjectTemplate package:
library(ProjectTemplate)

create.project("MyProject")
iii) Version Control
- Use Git for version control.
- Commit frequently with meaningful commit messages.
- Use branches for different features or experiments.
iv) Documentation
- Comment your code thoroughly, explaining the ‘why’ rather than the ‘what’.
- Use roxygen2 for function documentation.
- Create README files for your projects and packages.
v) Error Handling: Use tryCatch() for robust error handling.
vi) Performance Optimization
- Profile your code to identify bottlenecks:
library(profvis)

profvis({

  # Your code here

})- Vectorize operations when possible.
- Use appropriate data structures (e.g., data.table for large datasets).
Also Read: Is Coding Required For Data Science???
vii) Testing: Write unit tests for your functions using the testthat package.
viii) Reproducibility
- Use set.seed() for reproducible random number generation.
- Document your R session info.
sessionInfo()- Use renv for package management:
library(renv)

renv::init()
Remember, the R community is vast and supportive. Don’t hesitate to ask questions, contribute to open-source projects, or share your own knowledge as you progress in your R data science journey.
By following these best practices, you’ll be well-equipped to tackle complex data science challenges with R and continue growing as a data scientist.
Kickstart your Data Science journey by enrolling in GUVI’s Data Science Course where you will master technologies like MongoDB, Tableau, PowerBI, Pandas, etc., and build interesting real-life projects.
Alternatively, if you would like to explore data science using R, try GUVI’s Data Science with R.
Conclusion
R provides a comprehensive ecosystem for data science and machine learning, from data manipulation and visualization to advanced statistical analysis. This blog has provided an overview of the key concepts and tools you’ll need in your R data science journey. Remember, the field of data science is constantly evolving, so continuous learning and practice are key to success.
FAQs
R offers several key advantages for data science:
1. Extensive libraries for statistical analysis and data visualization
2. Versatility in handling various data science tasks
3. Detailed and customizable plots with the ggplot2 package
4. Strong and active community with abundant resources (tutorials, forums)
5. Open-source nature ensuring accessibility and continuous improvement
To get started with R for data science, follow these steps:
1. Download and install R from the CRAN website and RStudio as the IDE
2. Learn the basics of R syntax and data structures like vectors and data frames
3. Explore essential packages such as tidyverse for data manipulation and ggplot2 for visualization
4. Practice through small projects involving data cleaning and exploratory data analysis (EDA)
R can handle big data and integrates well with other big data tools:
1. Use the data.table package for high-performance data manipulation of large datasets
2. Integrate with Hadoop and Spark using packages like RHadoop and sparklyr for distributed data processing
3. Connect to databases such as MySQL and PostgreSQL with packages like DBI and RODBC for efficient data extraction and manipulation within database environments


![10 Impressive Data Visualization Project Ideas [With Source Code] 11 Data Visualization Project Ideas](https://www.guvi.in/blog/wp-content/uploads/2024/11/best_data_visualization_project_ideas_with_source_code_.webp)




Did you enjoy this article?