
In the vast sea of data, some points stand out – these are outliers. Outliers are data points that differ significantly from others in a dataset that don’t follow the usual patterns. Understanding outliers is important in data science because they can impact statistical analyses, skew results, and affect machine learning model performance.
However, outliers can also provide valuable insights or highlight important anomalies.
In this blog, we’ll explore outliers in data science, including their significance, detection methods, and handling techniques. You’ll gain the knowledge and tools to manage outliers effectively in your data analysis and modeling tasks.
Table of contents
- What are Outliers in Data Science?
- Importance of Outlier Detection in Data Science
- Methods for Detecting Outliers in Data Science
- Statistical Methods
- Machine Learning Approaches
- Visualization Techniques
- Handling Outliers
- Applications of Outliers
- Finance: Detecting Fraudulent Transactions
- Healthcare: Identifying Anomalies in Patient Data
- Manufacturing: Quality Control
- Best Practices and Considerations
- Conclusion
- FAQs
- What exactly is an outlier in data science?
- Are outliers always bad? Should they always be removed?
- How can I detect outliers in my dataset?
What are Outliers in Data Science?
Outliers are data points that are significantly different from other observations in a dataset. They lie at an abnormal distance from other values in a random sample from a population. In simpler terms, outliers are the odd ones out – the data points that don’t seem to fit the pattern established by the majority of the data.
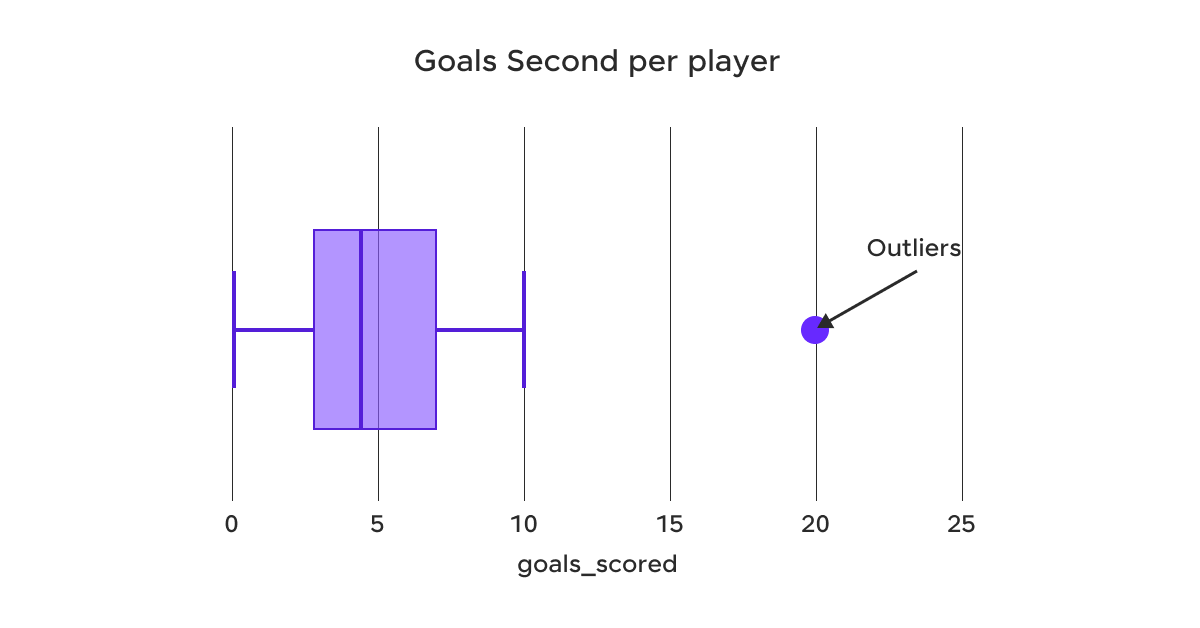
In the above example, the box plot illustrates the distribution of goals scored per player. The majority of players scored between 2 and 8 goals, as indicated by the interquartile range (the box). The whiskers extend to the minimum and maximum values within 1.5 times the interquartile range from the lower and upper quartiles, respectively.
However, there is an outlier at 20 goals, which is significantly higher than the rest of the data. This outlier represents a player who scored an exceptionally high number of goals compared to their peers.
Types of Outliers:
a) Univariate outliers: These are outliers that occur in a single variable or feature. For example, in a dataset of human heights, a recorded height of 3 meters would likely be a univariate outlier.
b) Multivariate outliers: These outliers only appear abnormal when considering the relationship between two or more variables. For example, a person’s weight might not be an outlier by itself, but when considered in relation to their height, it might be identified as an outlier.
c) Global outliers: These are data points that are exceptional with respect to all other points in the dataset.
d) Local outliers: These are data points that are outliers with respect to their local neighborhood in the dataset, but may not be outliers in the global context.
Causes of outliers:
- Measurement errors: These can occur due to faulty equipment or human error during data collection.
- Natural variation: Sometimes, outliers are genuine extreme values that occur naturally in the population.
- Data entry errors: Mistakes made during manual data entry, such as typos or decimal point errors.
- Data processing errors: Errors that occur during data transformation or aggregation.
- Sampling errors: When the sample doesn’t accurately represent the population.
- Intentional outliers: In some cases, outliers might be deliberately introduced, for example, in fraud detection scenarios.
Understanding the type and cause of outliers is the first step in deciding how to handle them appropriately.
Before we move into the next section, ensure you have a good grip on data science essentials like Python, MongoDB, Pandas, NumPy, Tableau & PowerBI Data Methods. If you are looking for a detailed course on Data Science, you can join GUVI’s Data Science Course with Placement Assistance. You’ll also learn about the trending tools and technologies and work on some real-time projects.
Additionally, if you want to explore Python through a self-paced course, try GUVI’s Python course.
Next, we’ll look at why detecting them is important for accurate data analysis and better decision-making.
Importance of Outlier Detection in Data Science
Outliers can have a profound impact on statistical analyses for data science. They can skew measures of central tendency like the mean, and inflate measures of variability like the standard deviation. This can lead to incorrect conclusions about the data.
For example, if you’re calculating the average income in a neighborhood, a single billionaire resident could significantly inflate the mean, giving a misleading picture of the typical income in the area.
Influence on machine learning models:
Many machine learning algorithms are sensitive to outliers. For example:
- In linear regression, outliers can disproportionately influence the slope of the regression line, leading to poor predictive performance.
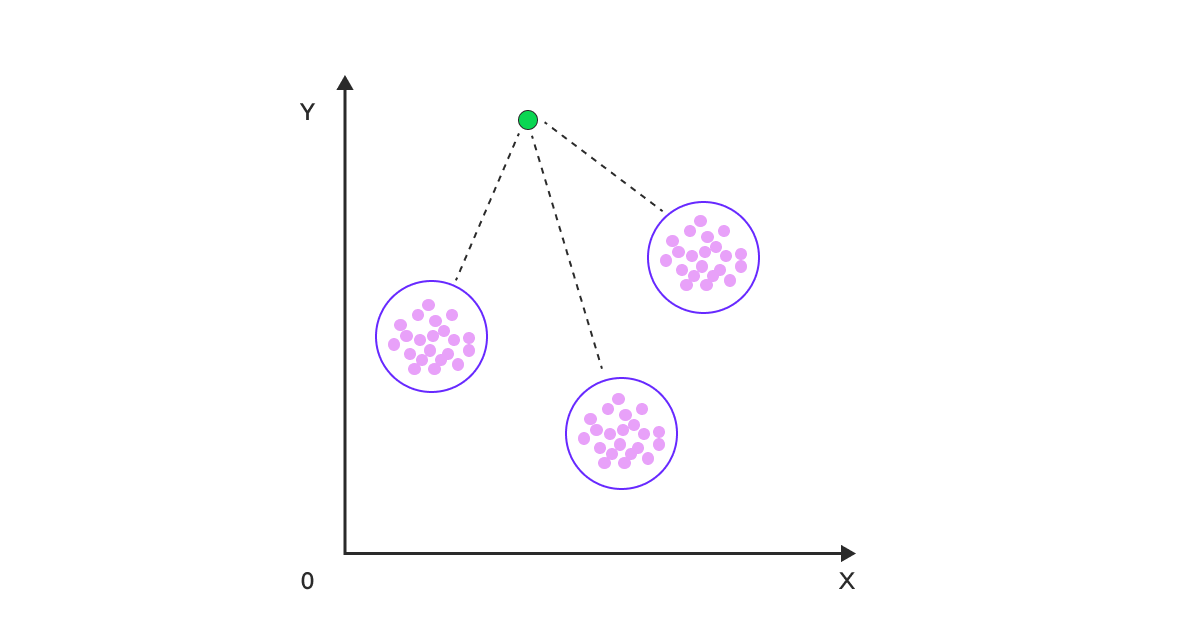
- In clustering algorithms like K-means, outliers can shift cluster centroids, potentially leading to suboptimal cluster assignments.
- In decision trees, outliers might create unnecessary splits, leading to overfitting.
Detecting and appropriately handling outliers is important for building robust and accurate machine-learning models.
Potential insights from outliers:
While outliers can be problematic, they can also provide valuable insights:
- In fraud detection, outliers in transaction data might indicate fraudulent activity.
- In manufacturing, outliers in quality control data could signal equipment malfunction.
- In medical research, genetic outliers might lead to discoveries about rare diseases.
Therefore, it’s important not to automatically discard outliers without first understanding what they might represent.
Now that we know why outlier detection matters, let’s look at the different methods for finding these anomalies.
Methods for Detecting Outliers in Data Science
The various methods for detecting outliers are as follows:
1. Statistical Methods
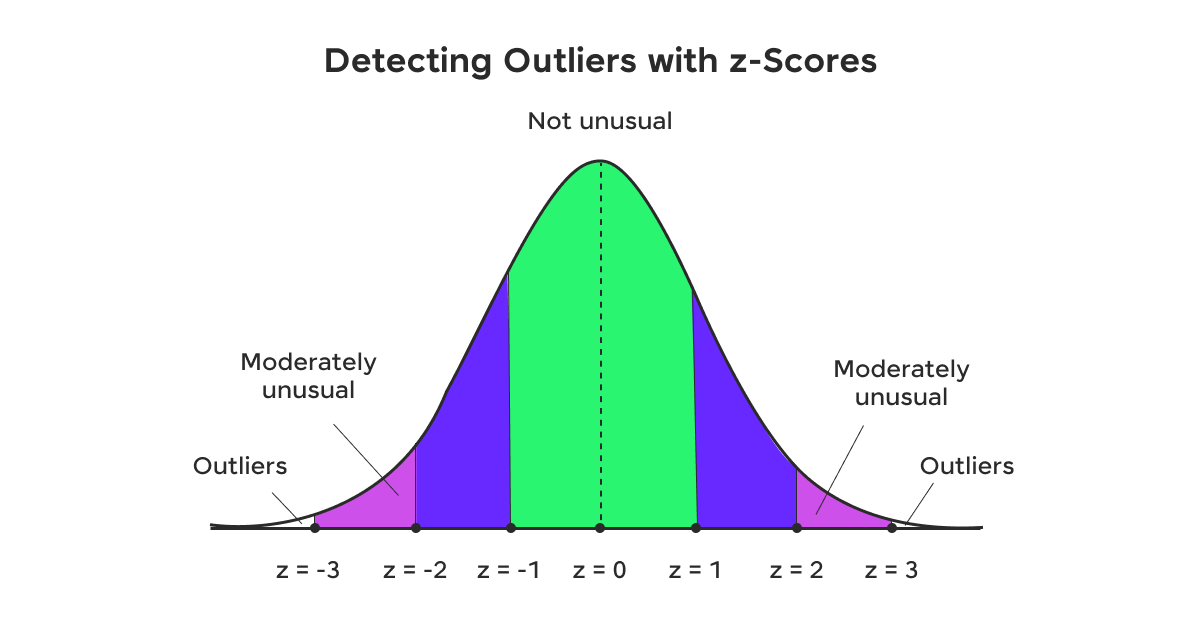
a) Z-score: This method assumes a normal distribution and considers data points beyond a certain number of standard deviations from the mean as outliers. Typically, points with a z-score greater than 3 or less than -3 are considered outliers.
b) Interquartile Range (IQR): This method defines outliers as points below Q1 – 1.5IQR or above Q3 + 1.5IQR, where Q1 and Q3 are the first and third quartiles, respectively.
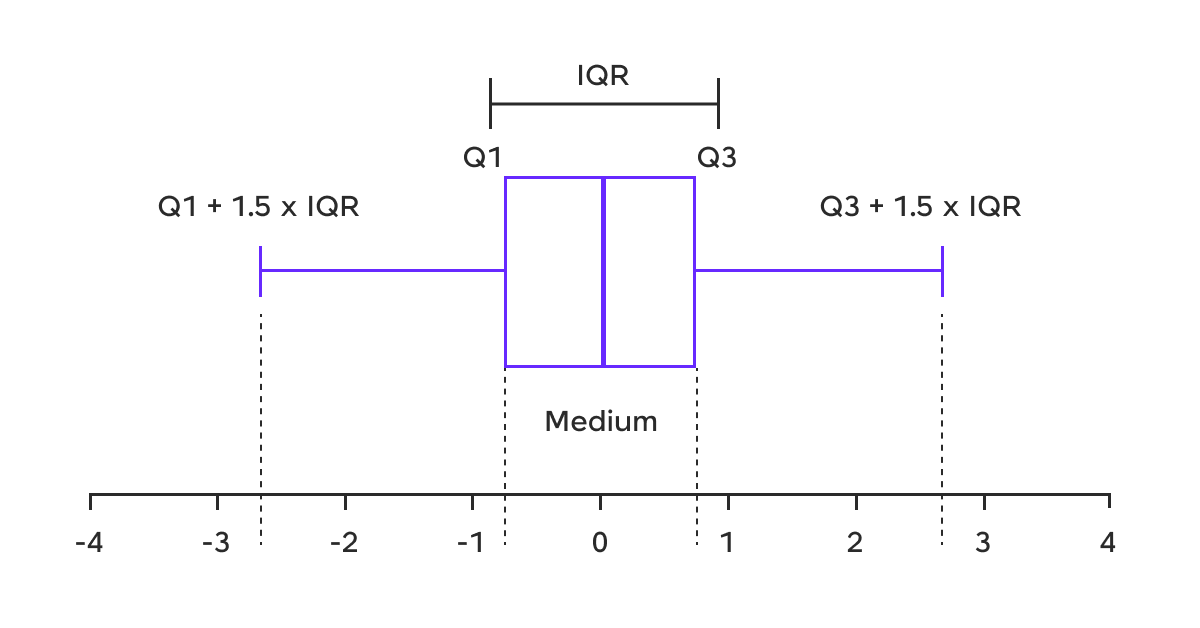
c) Tukey’s method: Similar to the IQR method, but uses a factor of 1.5 for “suspected” outliers and 3 for “definite” outliers.
2. Machine Learning Approaches
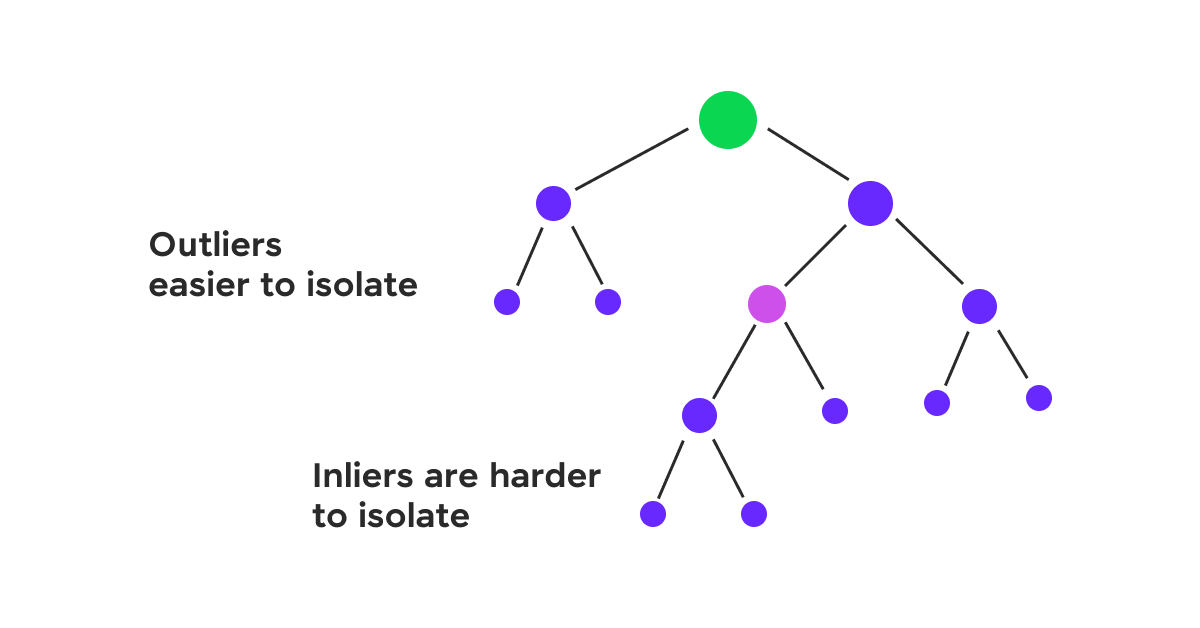
a) Isolation Forest: This algorithm isolates anomalies by randomly selecting a feature and then randomly selecting a split value between the maximum and minimum values of that feature.
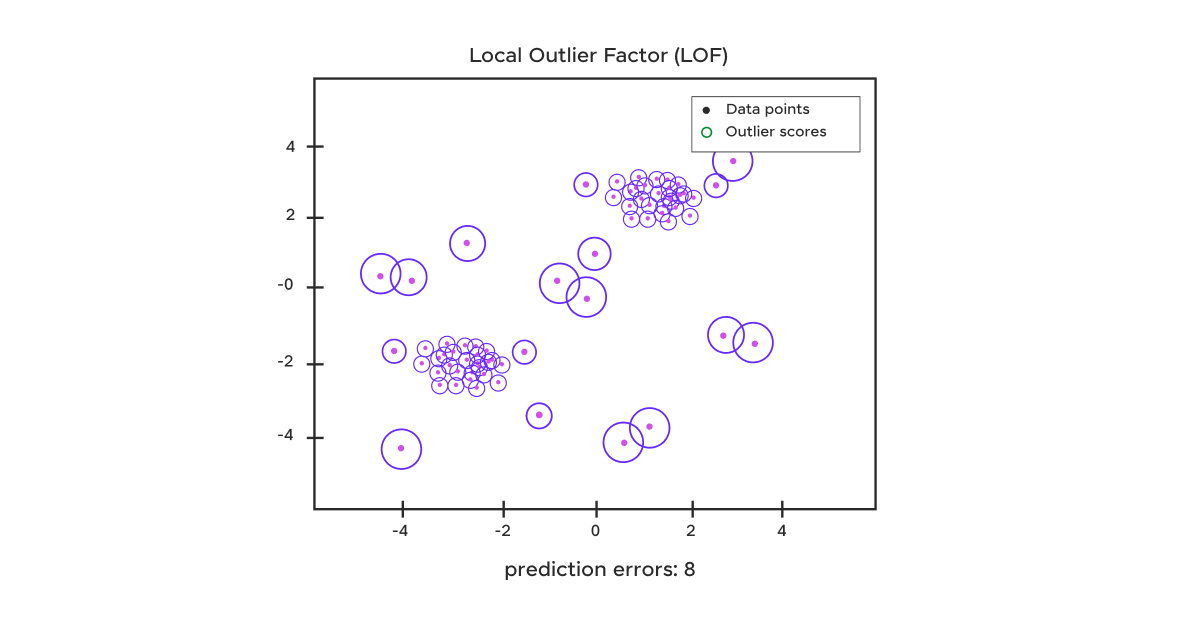
b) Local Outlier Factor (LOF): LOF compares the local density of a point to the local densities of its neighbors. Points that have a substantially lower density than their neighbors are considered outliers.
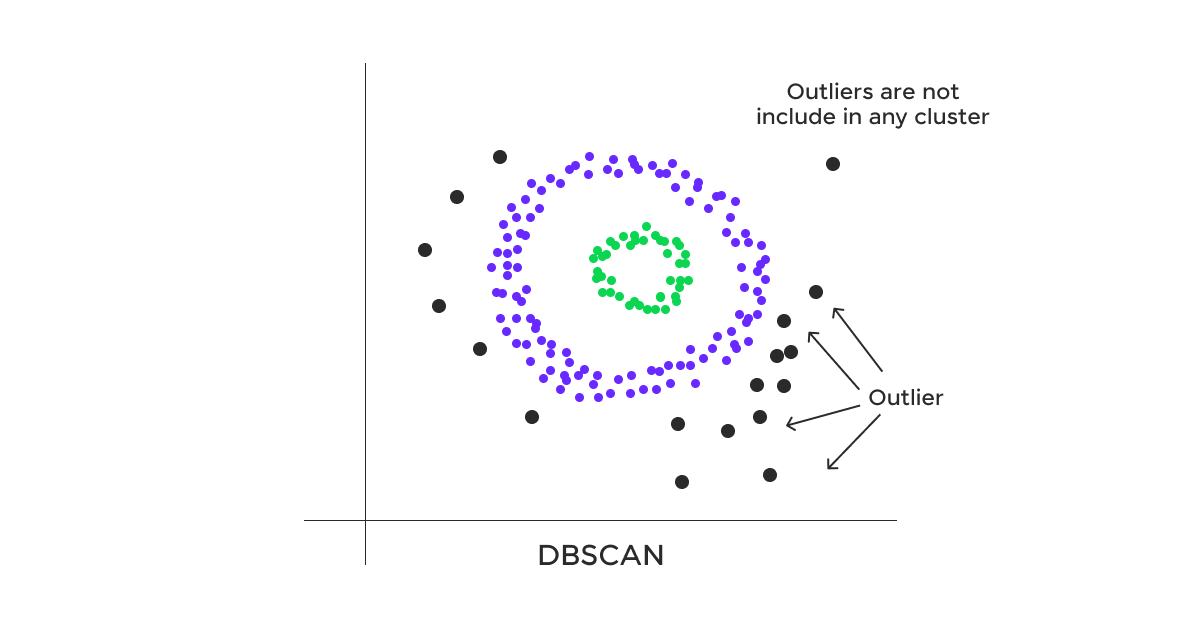
c) DBSCAN (Density-Based Spatial Clustering of Applications with Noise): While primarily a clustering algorithm, DBSCAN can effectively identify outliers as points that do not belong to any cluster.
3. Visualization Techniques
a) Box plots: These graphically depict groups of numerical data through their quartiles. Outliers are plotted as individual points beyond the whiskers.
b) Scatter plots: For two-dimensional data, scatter plots can visually reveal points that lie far from the main cluster of data.
c) Histograms: These can show the distribution of data and highlight values that fall outside the expected range.
Having covered how to detect outliers, let’s now look at how to handle them to maintain accurate and reliable data analysis.
Handling Outliers
If you’re in a doubt whether the outliers should be removed or not, consider the following cases:
- If the outlier is due to a measurement error or data entry mistake, it should be corrected if possible, or removed if correction is not feasible.
- If the outlier represents a genuine rare event or extreme value, removing it might result in the loss of important information.
- The impact of the outlier on your specific analysis or model should be considered. If it significantly alters your conclusions, you might need to use robust methods rather than simply removing it.
Transformation techniques:
- Logarithmic transformation: This can help when data is right-skewed with extreme values.
- Box-Cox transformation: A family of power transformations that includes log transformation as a special case.
- Winsorization: This involves capping extreme values to a specified percentile of the data.
Imputation methods:
- Mean/Median imputation: Replace outliers with the mean or median of the data.
- Regression imputation: Use other variables to predict and replace the outlier value.
- Multiple imputation: Generate multiple plausible imputed datasets and combine results obtained from each.
Robust statistical methods:
- Robust regression: Techniques like Huber regression or RANSAC that are less sensitive to outliers.
- Robust scaling: Using median and IQR instead of mean and standard deviation for scaling.
- Trimmed statistics: Using trimmed means or medians that exclude extreme values.
With handling outliers covered, let’s explore some examples to see these methods in action.
Applications of Outliers
Let us consider the following examples:
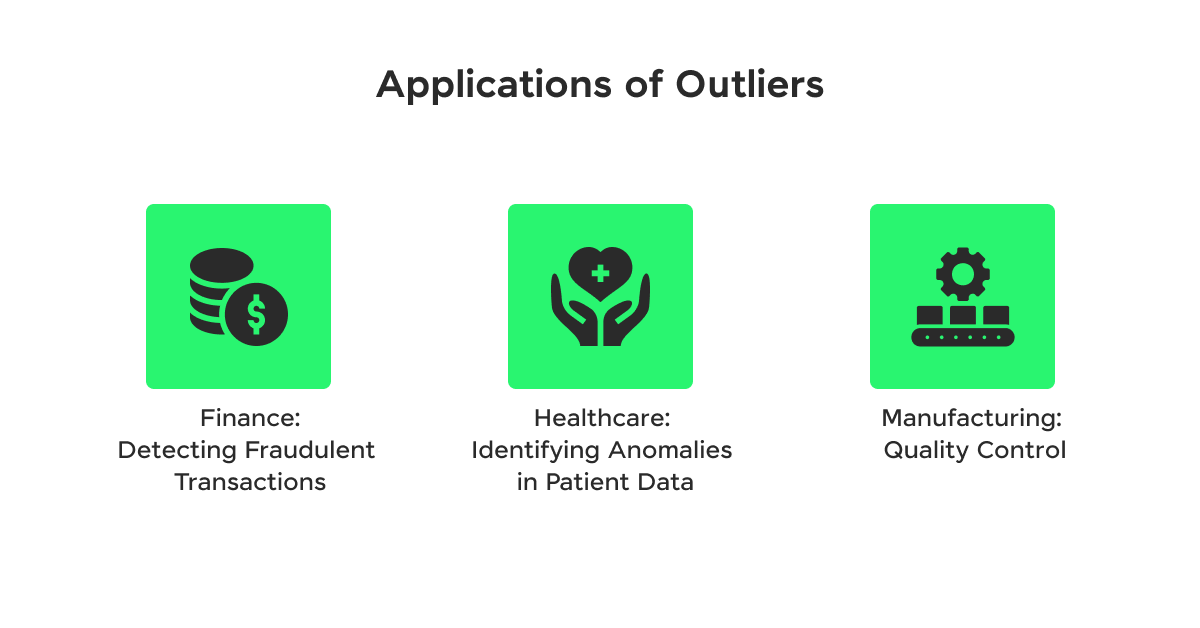
1. Finance: Detecting Fraudulent Transactions
In the financial sector, outlier detection plays an important role in identifying fraudulent transactions. For example, a major credit card company might use machine learning algorithms to flag unusual spending patterns. If a customer who typically makes small, local purchases suddenly makes a large transaction in a foreign country, this could be flagged as an outlier for further investigation.
In this case, the outlier detection method might combine several factors:
- Transaction amount (using z-score or IQR methods)
- Geographic location (using clustering in data science)
- Time of transaction (using time series analysis)
The company would need to balance sensitivity (catching all fraudulent transactions) with specificity (not flagging too many legitimate transactions as suspicious).
2. Healthcare: Identifying Anomalies in Patient Data
In healthcare, outliers can indicate both data quality issues and potential medical emergencies. For example, a hospital might monitor patients’ vital signs continuously. Outlier detection algorithms could be used to alert medical staff to sudden changes that might indicate a deteriorating condition.
Here, the challenges include:
- Dealing with multivariate data (multiple vital signs)
- Accounting for individual patient baselines
- Handling time series data with potential seasonality (e.g., changes in vitals during sleep)
Techniques like Local Outlier Factor (LOF) or Isolation Forests might be used, possibly combined with domain-specific rules based on medical knowledge.
3. Manufacturing: Quality Control
In manufacturing, outlier detection is often used for quality control and predictive maintenance. For example, a semiconductor manufacturer might monitor various parameters during the chip production process. Outliers in these parameters could indicate issues with the manufacturing equipment or process.
This scenario might involve:
- High-dimensional data from multiple sensors
- The need for real-time outlier detection
- Balancing the cost of false alarms with the cost of missed defects
Techniques like Principal Component Analysis (PCA) for dimensionality reduction followed by statistical control charts or machine learning-based anomaly detection could be employed.
Lessons learned from handling outliers in practice:
- Context is important: What constitutes an outlier can vary greatly depending on the specific domain and use case.
- Combining methods often yields better results: Using both statistical and machine learning approaches can provide more robust outlier detection.
- Continuous monitoring and adjustment are necessary: As data distributions can change over time, outlier detection methods need to be regularly reviewed and updated.
- Explainability is important: Especially in high-stakes domains like healthcare or finance, it’s important to be able to explain why a particular data point was flagged as an outlier.
Moving from examples, let’s explore the best practices and key considerations for effective implementation.
Best Practices and Considerations
When to keep outliers:
- When they represent rare but important events (e.g., in fraud detection or rare disease research)
- When working with small datasets where every data point is valuable
- When the outliers are a natural part of the data distribution for your domain
- When removing outliers would introduce bias into your analysis
Ethical considerations:
- Transparency: If outliers are removed or modified, this should be clearly documented and justified.
- Bias: Be aware that outlier removal can potentially introduce or amplify bias in your data.
- Privacy: In some cases, outliers might be more easily identifiable, potentially compromising individual privacy.
- Fairness: Ensure that outlier detection and handling methods don’t unfairly impact protected groups.
Documenting outlier treatment:
Proper documentation of outlier treatment is important for reproducibility and transparency. This documentation should include:
- The definition of outliers used in the context of your data and problem
- Methods used for detecting outliers
- Justification for the chosen outlier handling approach
- Details of any data points removed or modified
- The impact of outlier treatment on your analysis or model results
Kickstart your Data Science journey by enrolling in GUVI’s Data Science Course where you will master technologies like MongoDB, Tableau, Power-BI, Pandas, etc., and build interesting real-life data science projects.
Alternatively, if you would like to explore Python through a Self-paced course, try GUVI’s Python certification course.
Conclusion
Outliers present both challenges and opportunities. They can provide valuable insights when properly understood and handled. As the importance of data science continues to evolve, new techniques in deep learning and real-time analytics will enhance outlier detection and treatment. However, the fundamentals of understanding your data, considering context, and maintaining ethical standards remain important.
Remember, outliers aren’t just anomalies; they often reveal the most interesting stories in your data. Approach them with curiosity, handle them with care, and you might gain insights that drive real-world impact.
FAQs
An outlier in data science is a data point that significantly differs from other observations in a dataset. It’s a value that lies an abnormal distance from the other values in a random sample from a population. In statistical terms, outliers are often defined as observations that fall below Q1 – 1.5IQR or above Q3 + 1.5IQR, where Q1 and Q3 are the first and third quartiles, and IQR is the interquartile range.
No, outliers are not always bad, and they should not always be removed. While outliers can sometimes distort statistical analyses and affect the performance of machine learning models, they can also provide valuable insights. For example, in fraud detection, outliers might indicate fraudulent activity. In scientific research, outliers could point to new phenomena.
There are several methods to detect outliers:
1. Statistical methods: These include using z-scores (for normally distributed data), the Interquartile Range (IQR) method, or Tukey’s method.
2. Visualization techniques: Box plots, scatter plots, and histograms can help visually identify outliers.
3. Machine learning approaches: Algorithms like Isolation Forests, Local Outlier Factor (LOF), or DBSCAN can be used for more complex datasets.
4. Domain-specific rules: In some cases, you might use rules based on domain knowledge to identify outliers.
The choice of method often depends on the nature of your data, the dimensionality of your dataset, and your specific use case. It’s often beneficial to use multiple methods and compare results.


![10 Impressive Data Visualization Project Ideas [With Source Code] 13 Data Visualization Project Ideas](https://www.guvi.in/blog/wp-content/uploads/2024/11/best_data_visualization_project_ideas_with_source_code_.webp)





Did you enjoy this article?