
Supervised and Unsupervised Learning: Explained with detailed categorization.
Mar 05, 2025 7 Min Read 7835 Views
(Last Updated)
Machine learning and AI have become the talk of the tech town!
Every day in our day-to-day life, we come across plenty of Artificial intelligence applications. Just look around you- from self-driving TESLA cars that navigate our streets with precision to personalized YouTube or Netflix recommendations that know our tastes better than we do, (and make us go down the rabbit hole) the popularity of machine learning has reached unprecedented heights. But how do these intricate systems work?
In this blog, we embark on a journey through the heart of Machine Learning, shedding light on two primary approaches: Supervised and Unsupervised Learning. These techniques form the backbone of countless systems, fueling innovations that touch our lives daily.
Well to put it simply — On the most basic level, Supervised learns from labelled data, and unsupervised does not require labelled data and finds patterns in unlabeled data. However, the field is pretty vast and there are a bunch of nuances and categorizations that you should know about. This article aims to demystify the key differences between these two fundamental approaches in a straightforward and accessible manner. So let’s begin.
Table of contents
- Unraveling the Potential of Machine Learning: What's the Aim?
- What is Supervised Learning?
- Supervised Machine Learning methods
- Classification: Making Sense of Data
- Regression: Predicting Continuous Values
- What is Unsupervised Learning?
- Unsupervised Machine Learning Methods
- Clustering: Grouping Similar Data
- Dimensionality Reduction: Simplifying Complex Data
- Supervised vs Unsupervised Learning
- In the end,
- Frequently Asked Questions
- What is the main difference between supervised and unsupervised learning?
- How do these machine-learning approaches impact real-world applications?
- Can these approaches handle large datasets?
Unraveling the Potential of Machine Learning: What’s the Aim?
Machine Learning, in its essence, aims to teach computers how to learn and make intelligent decisions without being explicitly programmed. It’s like giving machines the ability to observe, learn from data, and improve their performance over time, just like humans do.
The primary goal is to enable computers to recognize patterns, make predictions, and uncover insights from vast amounts of information. By harnessing the power of algorithms and data, Machine Learning empowers us to automate tasks, enhance decision-making, and unlock the hidden potential within our data-driven world.
Make sure you understand machine learning fundamentals like Python, SQL, deep learning, data cleaning, and cloud services before we explore them in the next section. You should consider joining GUVI’s Artificial Intelligence & Machine Learning Course, which covers tools like Pyspark API, Natural Language Processing, and many more and helps you get hands-on experience by building real-time projects.
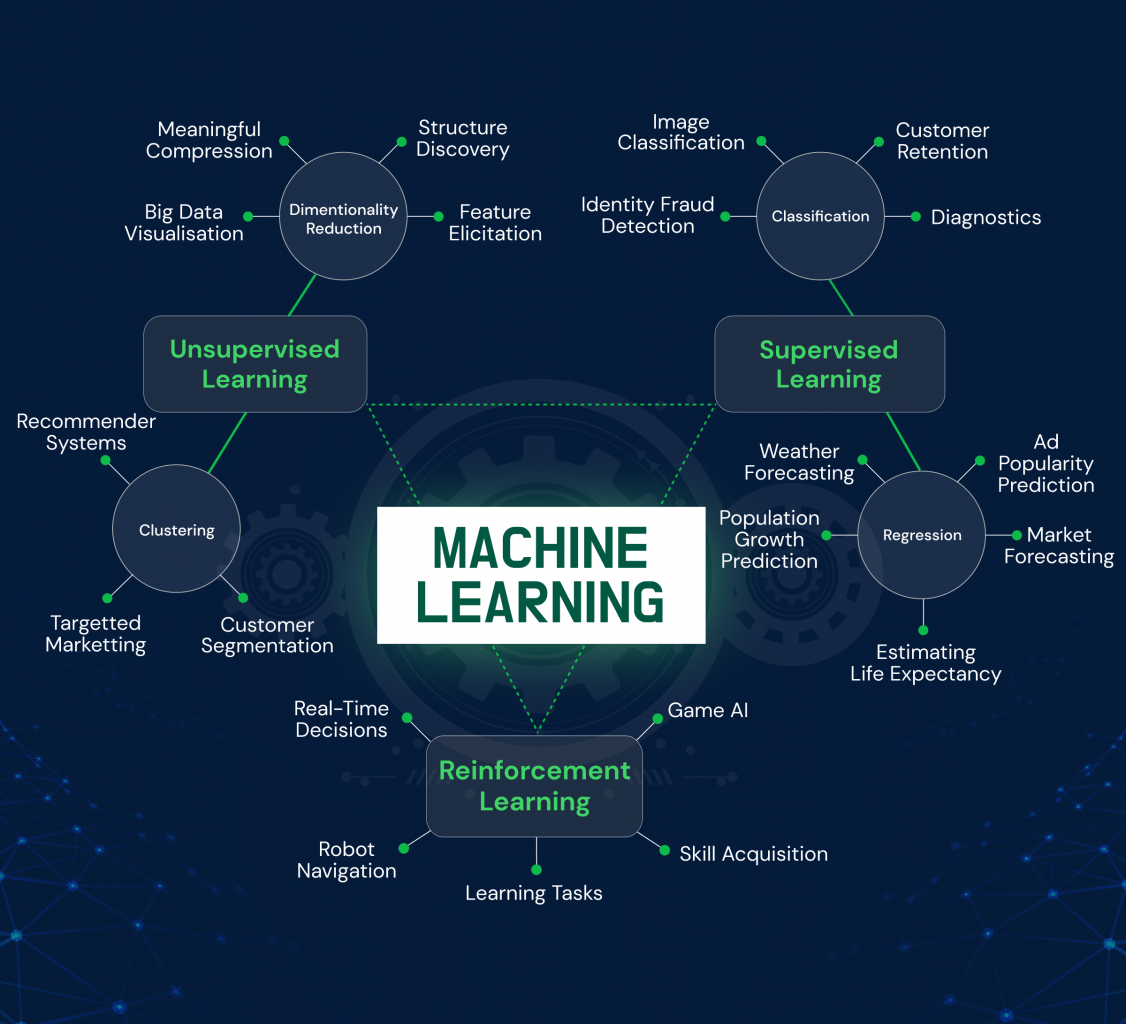
To further understand the diverse branches of learning in Machine Learning, check out our detailed branch tree infographic below. It visually represents the various types of learning approaches, such as Supervised Learning, Unsupervised Learning, and Reinforcement Learning.
Explore the infographic to discover the unique characteristics and applications of each learning type, unraveling the fascinating tapestry of Machine Learning techniques.
What is Supervised Learning?
Supervised Learning is a powerful machine learning technique where computers learn from labelled examples to make predictions or classify new, unseen data. It’s like having a knowledgeable teacher guiding the learning process.
In this approach, we provide the computer with a dataset where each example is labelled with the correct answer or outcome. The computer then learns to identify patterns and relationships in the data to make accurate predictions when confronted with new, unlabeled instances.
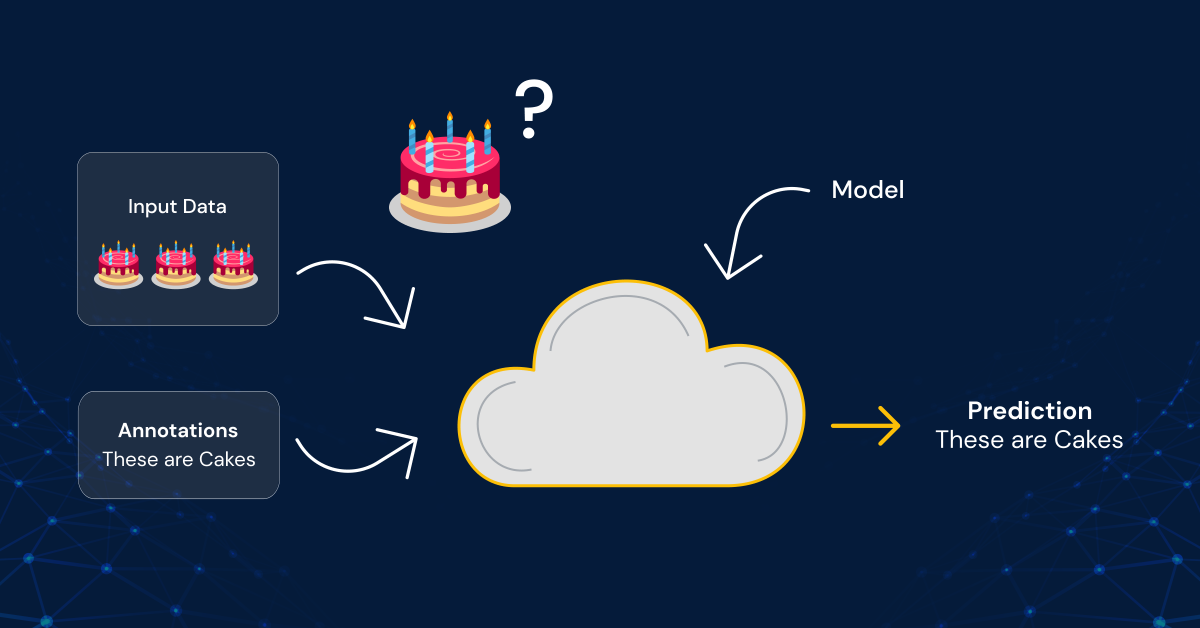
Supervised Learning can be likened to feeding a hungry computer model with a single cake example. We provide the model with features of the cake, such as its ingredients, texture, and appearance.
This labelled data serves as the training ground for the model. By examining the unique characteristics of the cake, the model learns to associate specific features with its type.
Once the model has absorbed this knowledge, it can accurately predict the type of similar cakes it encounters in the future. Supervised Learning enables computers to learn from specific examples, allowing them to generalize their understanding and make informed decisions based on the provided training data.
Supervised Machine Learning methods
There are primarily two types of Supervised Machine Learning methods: Classification and regression.
Classification: Making Sense of Data
Classification is a popular Supervised Learning method used to categorize data into predefined classes or labels. It enables machines to learn patterns from labelled examples and make predictions about the class of new, unseen instances. Let’s explore some common classification algorithms:
1. Decision Tree: Making Sequential Decisions
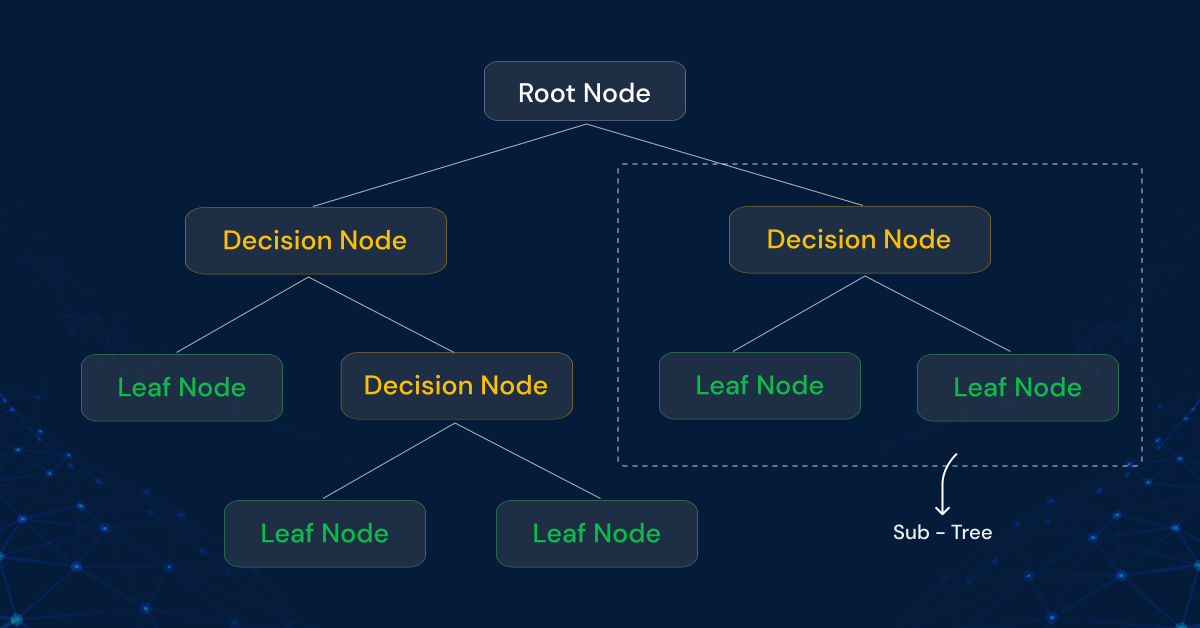
A Decision Tree is like a flowchart that sequentially guides decision-making. It splits the data based on different features to create a tree-like structure. At each node, the tree considers a specific feature and its value to determine the next step. Decision Trees are easy to interpret and visualize, making them useful for both classification and regression tasks.
2. Random Forest: The Power of Ensemble Learning
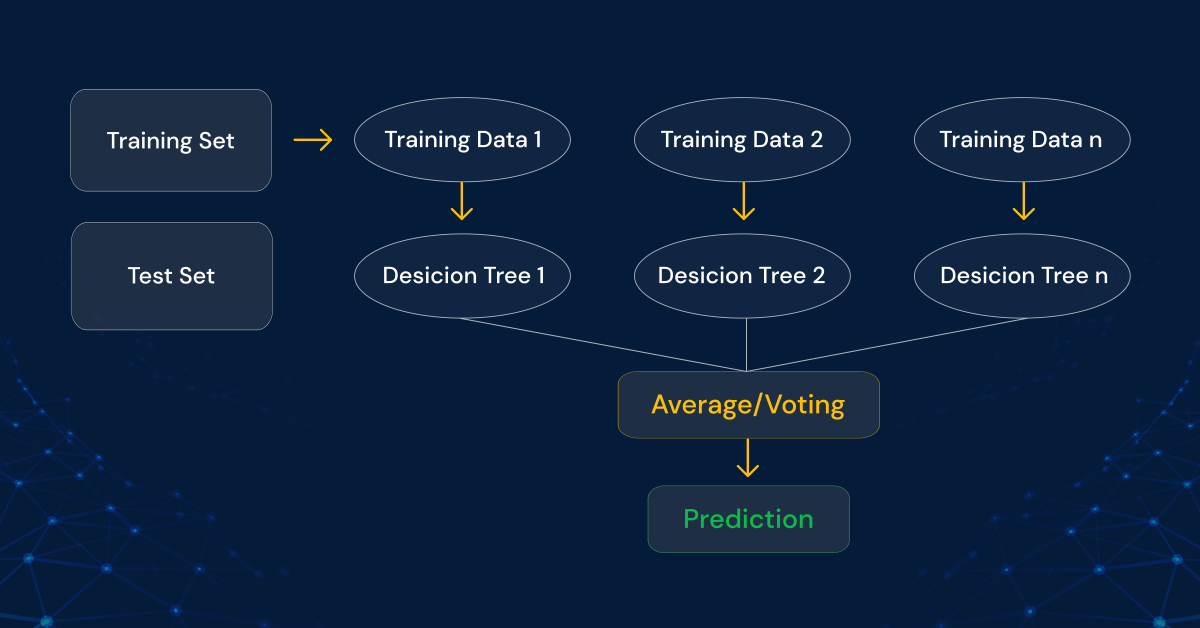
Random Forest is an ensemble learning method that combines multiple Decision Trees to make accurate predictions. Each tree is built on a random subset of the training data and features. By aggregating the predictions of individual trees, Random Forest improves the model’s robustness and generalization ability, making it effective for complex classification tasks.
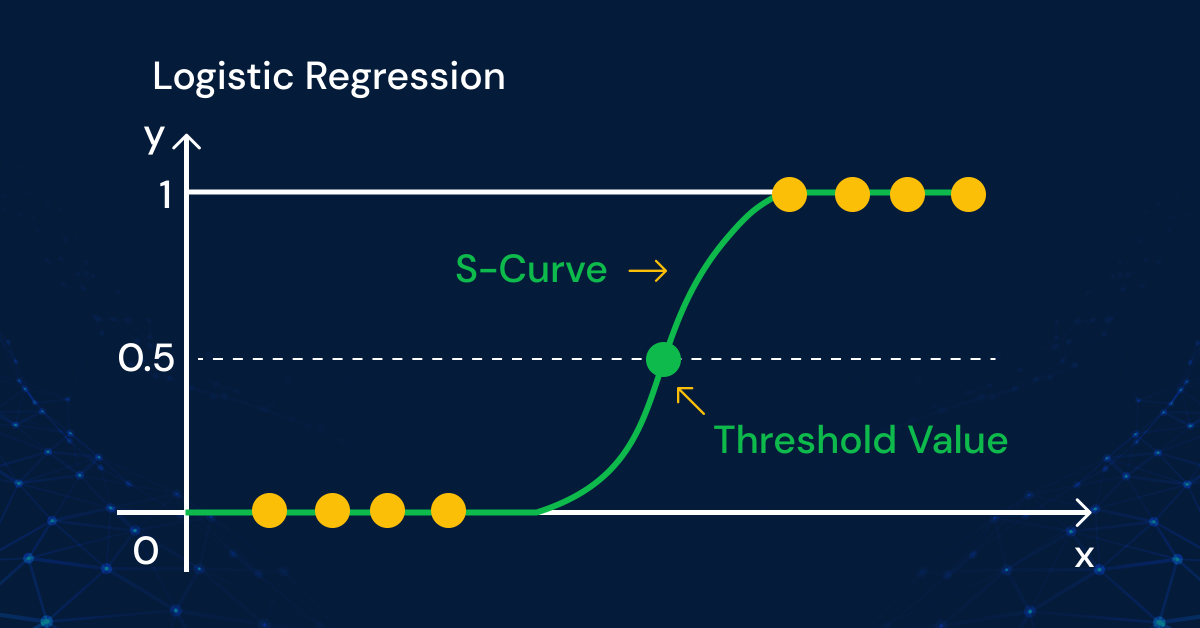
3. Logistic Regression: Predicting Probabilities
Despite its name, Logistic Regression is a classification algorithm commonly used for binary classification tasks. It models the relationship between the input features and the probability of belonging to a specific class. By applying a logistic function to the linear combination of features, it estimates the likelihood of an instance belonging to a particular class. The algorithm predicts the probability of the new data, and so its output lies between the range of 0 and 1.
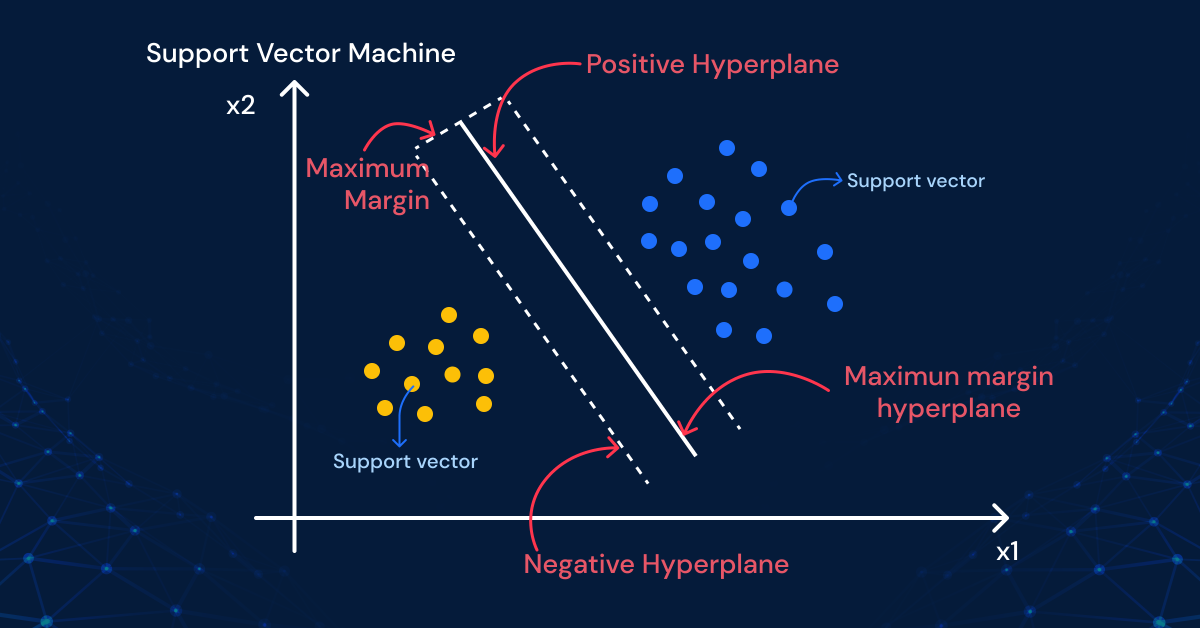
4. Support Vector Machine (SVM): Finding Optimal Decision Boundaries
Support Vector Machines (SVM) is a powerful and versatile classification algorithm in machine learning. It aims to find the optimal decision boundary, known as the hyperplane, that separates different classes in the data. SVM maximizes the margin between the classes, which is the distance between the hyperplane and the nearest data points from each class. This margin maximization allows SVM to achieve robust classification performance.
SVM is capable of handling both linear and nonlinear classification problems through the use of kernel functions. These functions transform the input data into a higher-dimensional space, where a linear decision boundary can effectively separate the classes. Commonly used kernel functions include linear, polynomial, and radial basis functions (RBF).
5. K-Nearest Neighbors (K-NN): Proximity Matters
K-Nearest Neighbors (K-NN) is a simple yet effective supervised learning algorithm commonly used for both- classification and regression tasks. However, KNN is more widely used in classification problems in the industry. In K-NN, the class or value of an unseen data point is determined by its proximity to the K nearest neighbors in the feature space.
During the training phase, K-NN stores the labelled data points in a data structure such as a KD-tree or a ball tree for efficient nearest neighbor search. When predicting the class or value of a new instance, K-NN measures the distance between the new instance and the training instances using metrics like Euclidean distance or Manhattan distance.
The value of K in K-NN determines the number of nearest neighbors considered for classification or regression. For classification, the majority vote of the K nearest neighbors determines the class label. In regression, the average or weighted average of the K nearest neighbors’ values is used as the predicted value.
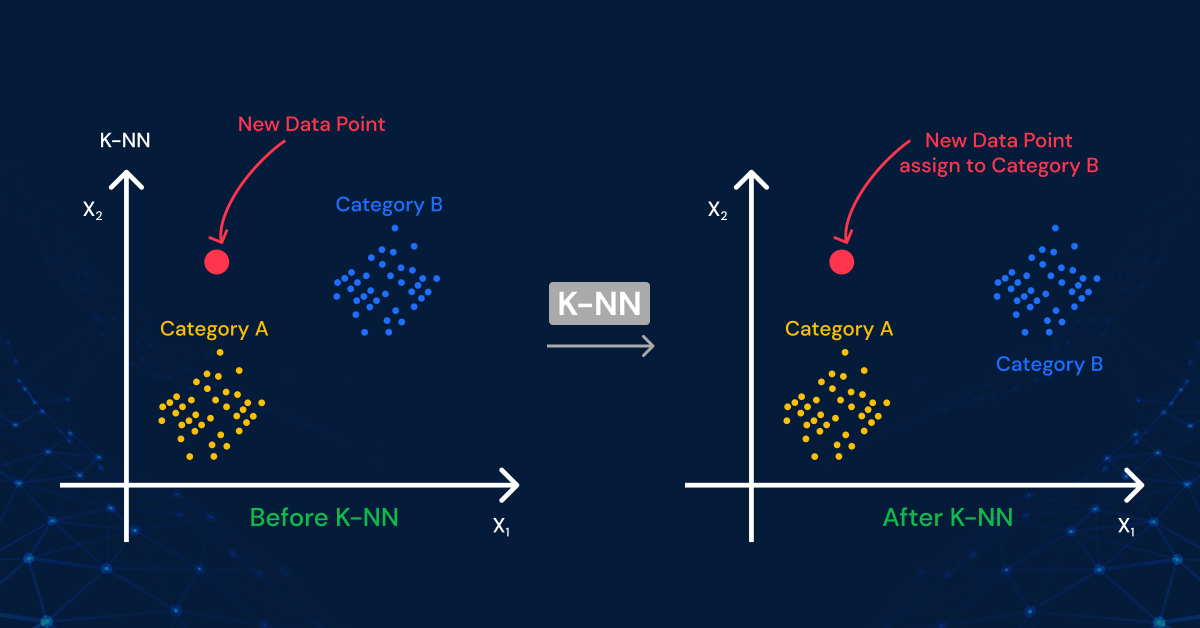
K-NN is a non-parametric algorithm, meaning it does not make assumptions about the underlying data distribution. It can handle multi-class classification tasks and does not require explicit model training. However, the choice of K is crucial as a small K value can lead to overfitting, while a large K value can result in over smoothing.
Regression: Predicting Continuous Values
Regression is a widely used supervised learning technique that helps predict continuous numerical values based on input features. Unlike classification, which deals with categorical labels, regression algorithms focus on estimating the relationship between variables and making predictions within a continuous range. Let’s explore some common regression algorithms:
1. Linear Regression: Straightforward Relationships
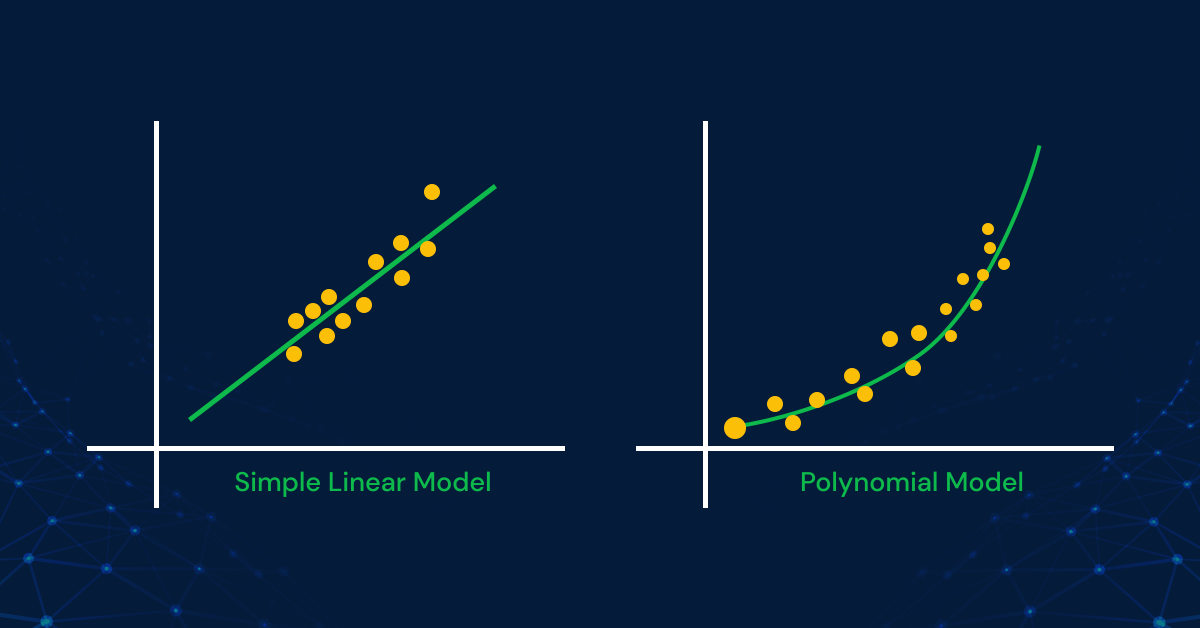
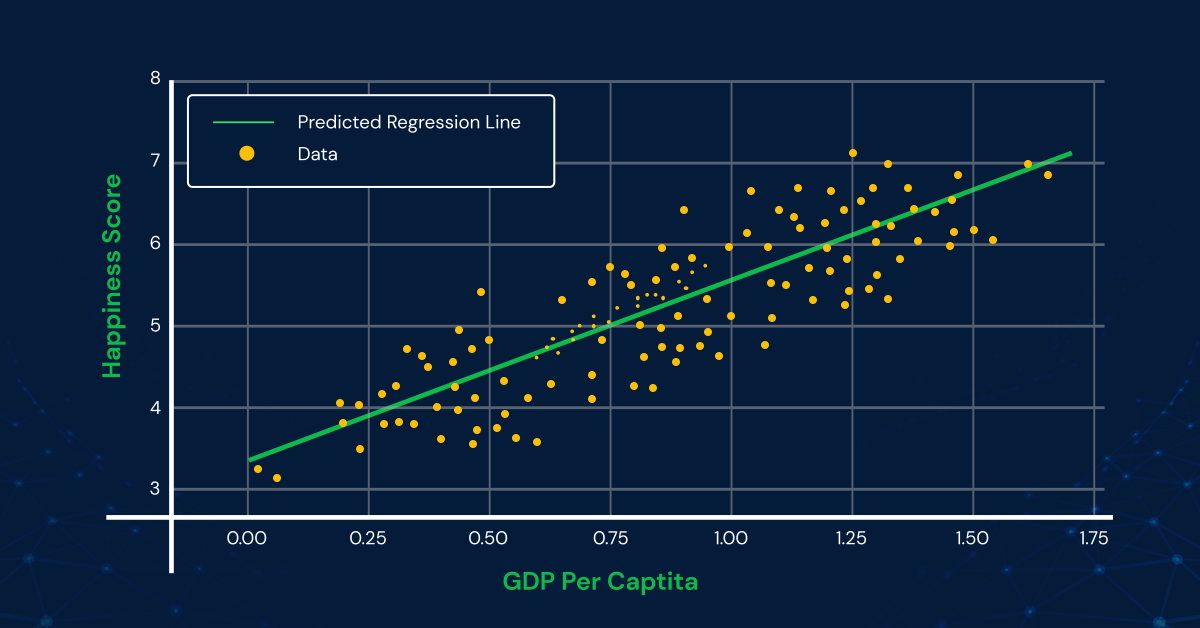
Linear Regression is a basic and widely applied regression algorithm. It assumes a linear relationship between the input features (x) and the target variable (y). Imagine drawing a straight line through a scatter plot of data points—the goal of Linear Regression is to find the best-fitting line that minimizes the distance between the predicted values and the actual data.
To understand how it works, let’s take an example: predicting the happiness score of countries based on their GDP per capita. We collect data on various countries, with each data point representing a country’s GDP per capita and corresponding happiness score. By fitting a line to this data, we can estimate the happiness score of a country based on its GDP per capita.
The line represents the relationship between the two variables: GDP per capita (input feature) and happiness score (target variable). The slope of the line determines how much the happiness score changes with a unit increase in GDP per capita. The intercept of the line represents the predicted happiness score when the GDP per capita is zero.
Adding a scatter plot of data points and the line of best fit to the picture will provide a visual representation of Multiple Linear Regression. By analyzing the line’s slope and intercept, we can gain insights into the relationship between variables and make predictions based on new input values. Linear Regression is widely used in various fields, including economics, finance, and social sciences, to understand and forecast numerical outcomes.
2. Polynomial Regression: Capturing Nonlinear Relationships
Polynomial Regression extends linear models by incorporating higher-degree polynomial terms. It can capture nonlinear relationships between the input features and the target variable. By fitting a curve instead of a straight line, Polynomial Regression provides a more flexible approach to modelling complex patterns in the data.
3. Ridge Regression: Dealing with Multicollinearity
Ridge Regression is a regularization technique that addresses multicollinearity, a situation where input features are highly correlated. It adds a penalty term to the loss function during model training, which helps reduce the impact of multicollinearity. Ridge Regression can prevent overfitting and provide more stable predictions when dealing with correlated features.
What is Unsupervised Learning?
Unsupervised Learning is a branch of machine learning where the focus is on extracting patterns, structures, or relationships from unlabeled data. Unlike supervised learning, unsupervised learning algorithms do not rely on predefined labels or target values. Instead, they explore the data to uncover hidden patterns and make sense of the information.
Let’s consider a simple example to understand unsupervised learning: differentiating between cakes and ice creams based solely on their visual features. Imagine we have a collection of images showing various cakes and ice creams. By applying unsupervised learning techniques, the algorithm can automatically group similar images together without any prior knowledge of which images represent cakes or ice creams.
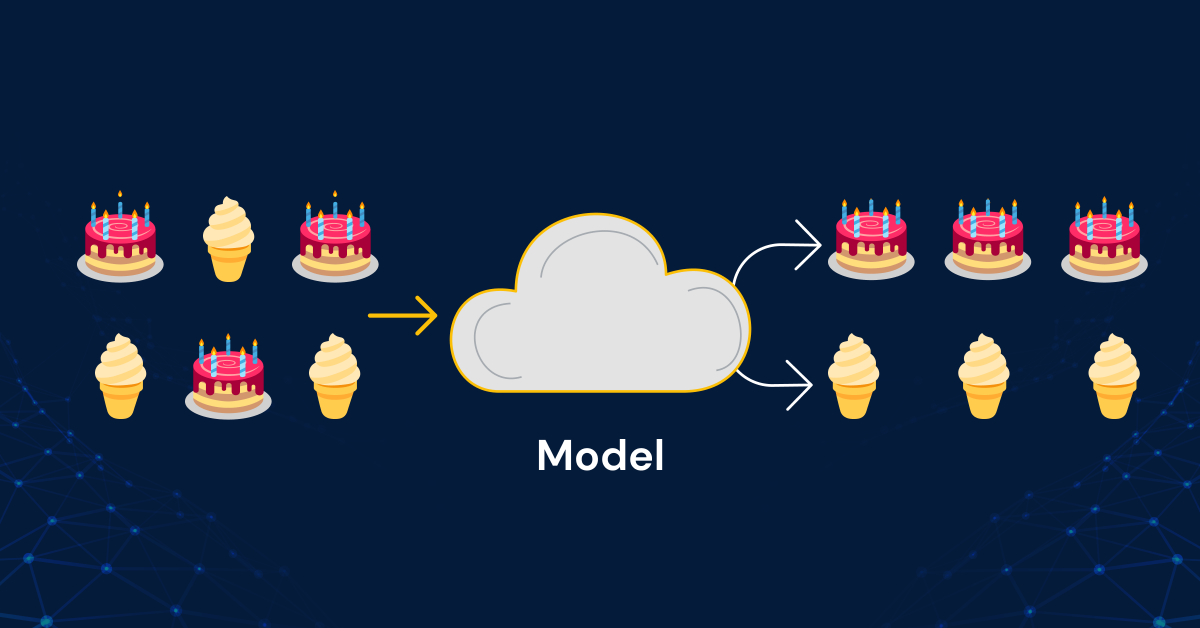
The algorithm analyzes the visual characteristics, such as colour, shape, and texture, and identifies patterns that distinguish cakes from ice creams. It learns to cluster images that share common features, enabling it to differentiate between the two types of desserts.
Unsupervised Machine Learning Methods
Unlike supervised learning, unsupervised learning operates on unlabeled data, making it a valuable tool for data exploration, dimensionality reduction, and anomaly detection. Unsupervised learning methods are classified into categories: Clustering and association methods.
Clustering: Grouping Similar Data
Clustering is an essential unsupervised machine-learning technique that helps identify natural groupings or clusters within data. It aims to find similarities or patterns in the data without the need for predefined labels. By organizing similar data points into clusters, clustering algorithms provide insights into the inherent structure and relationships present in the dataset. Let’s explore two popular types of clustering algorithms:
1. K-Means Clustering: Dividing into Distinct Groups
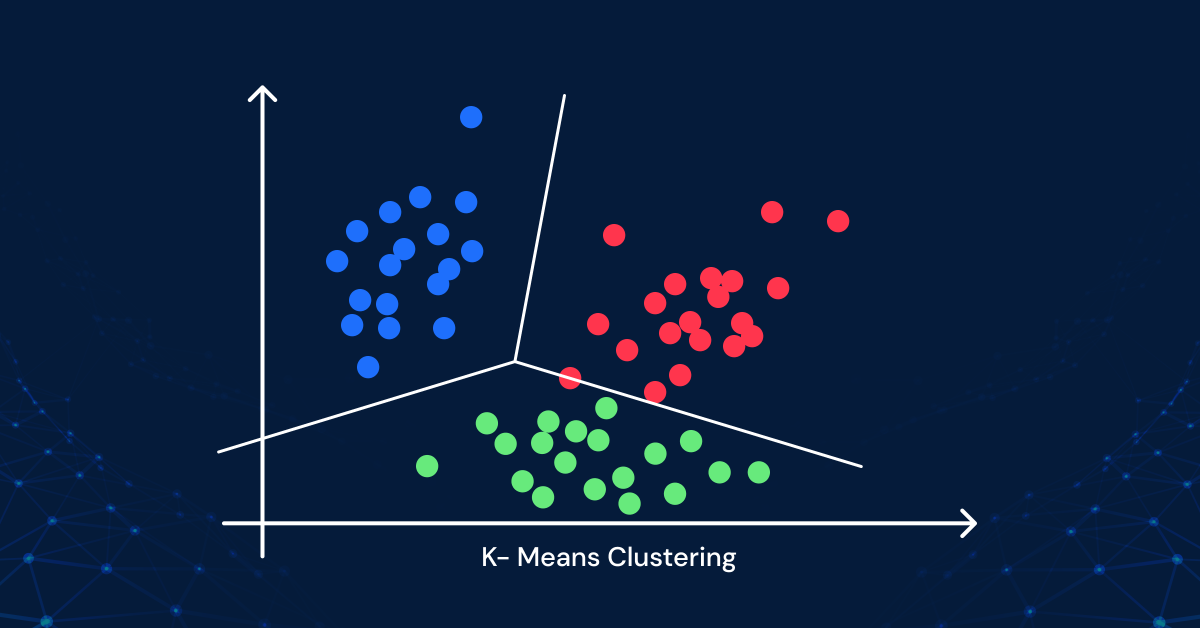
K-Means clustering is a widely used algorithm that partitions data points into distinct groups or clusters. The algorithm works by iteratively assigning each data point to the nearest centroid, which represents the centre of a cluster, and then recalculating the centroids based on the newly assigned data points. This process continues until the centroids stabilize, and the clusters are formed.
To understand K-Means clustering, imagine having a collection of various fruits, and you want to group them based on their similarities. The k-Means clustering algorithm would analyze the features of the fruits, such as colour, shape, and size, and group them into clusters based on their similarity. For example, apples may form one cluster, oranges another, and bananas a separate cluster. This algorithm allows us to organize the fruits into distinct groups without any prior knowledge of their labels.
2. Hierarchical Clustering: Discovering Structures at Different Scales
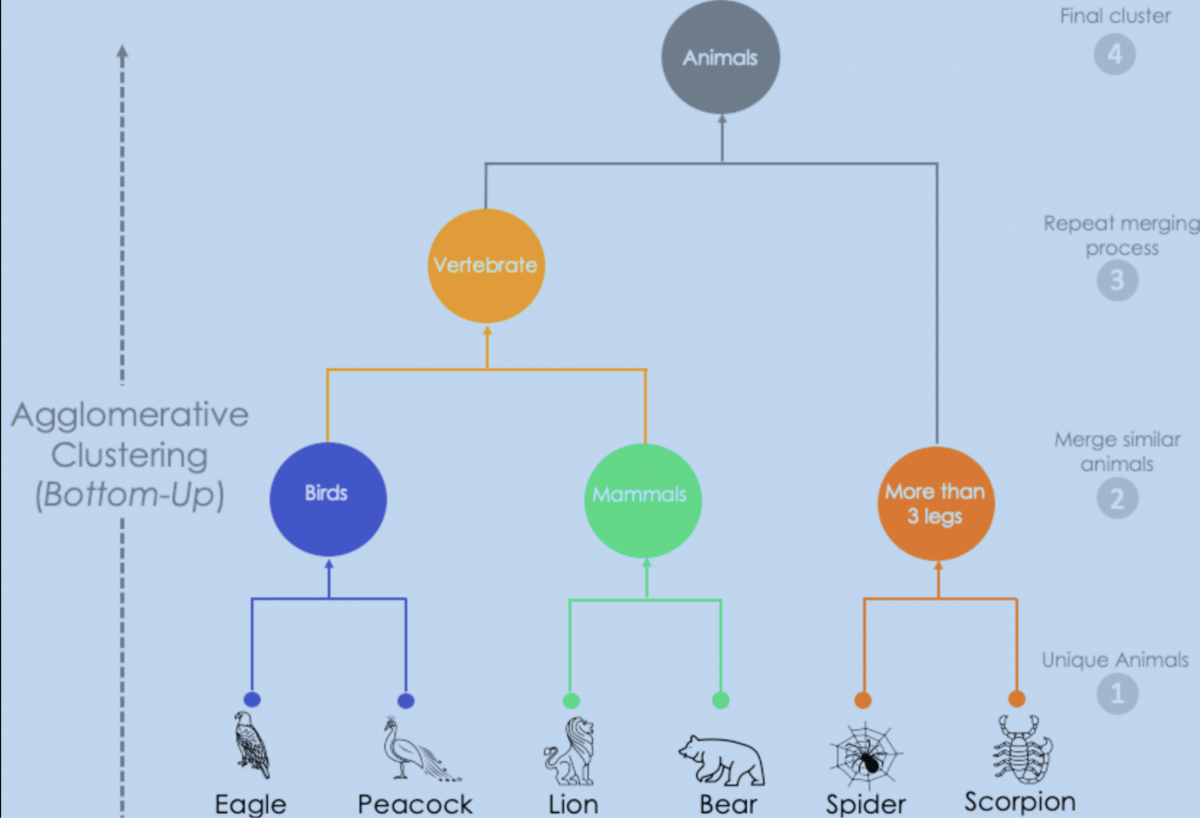
Hierarchical Clustering is another clustering technique that creates a hierarchical structure of clusters. It starts with each data point in its own cluster and then gradually merges similar clusters, forming a tree-like structure known as a dendrogram. This dendrogram captures the hierarchical relationships and allows us to identify clusters at different scales.
Imagine a scenario where you have different animals and want to group them based on their characteristics. Hierarchical clustering would create a dendrogram that shows the relationships between the animals at different levels. At the lower levels, similar animals with common characteristics, such as mammals or birds, would form clusters. At higher levels, these clusters would merge to form broader categories like land animals or aquatic creatures. Hierarchical clustering helps us understand the structure and organization of the animal kingdom based on their shared traits.
Dimensionality Reduction: Simplifying Complex Data
Dimensionality reduction techniques aim to simplify complex datasets by reducing the number of features while preserving important information. These methods help in visualizing high-dimensional data and extracting meaningful representations. Principal Component Analysis (PCA) is a commonly used technique that identifies the most informative features by transforming the data into a lower-dimensional space. Another technique, t-SNE (t-Distributed Stochastic Neighbor Embedding), is useful for visualizing high-dimensional data in a two- or three-dimensional space while preserving local structures and relationships.
Other unsupervised learning methods include anomaly detection, where the goal is to identify data points that deviate significantly from the norm, and association rule learning, which discovers interesting relationships and dependencies among variables.
Supervised vs Unsupervised Learning
The following table provides a summary comparison between Supervised and Unsupervised Learning based on various metrics. Supervised learning relies on labelled data to predict the target variable, while unsupervised learning discovers patterns and structures in unlabeled data. The training process, types of algorithms, performance evaluation metrics, and use cases differ between the two approaches. Supervised learning focuses on accuracy and precision, while unsupervised learning utilizes metrics like Silhouette Coefficient and Inertia. Interpretability varies, with supervised learning models being more interpretable.
| Metrics | Supervised Learning | Unsupervised Learning |
|---|---|---|
| Input Data | Labelled | Unlabeled |
| Objective | Predict target variable | Discover patterns/structures |
| Training Process | Requires labelled data | Doesn’t require labels |
| Types of Algorithms | Classification, Regression | Clustering, Dimensionality Reduction, Anomaly Detection, Association Rule Learning |
| Performance Evaluation | Accuracy, Precision, Recall | Silhouette Coefficient, Inertia, Dunn Index |
| Use Cases | Email Spam Filtering, Image Classification, Credit Scoring | Customer Segmentation, Image Segmentation, Anomaly Detection, Market Basket Analysis |
| Interpretability | Interpretable models | Patterns and structures are more difficult to interpret |
| Data Requirements | Labelled data for training | Unlabeled data for exploration and discovery |
| Scalability | Can handle large datasets | Can handle large datasets, but complexity can increase with data size |
| Human Effort | Requires manual labelling | Less manual effort for labelling, but may require human interpretation and validation |
In the end,
We’ve ventured into the exciting world of machine learning, where intelligent systems learn from data to make predictions and discoveries. Supervised learning, with its labelled data and target-oriented approach, has proven its mettle in tasks like image classification, spam filtering, and credit scoring. On the other hand, unsupervised learning, the adventurous explorer of unlabeled data, unveils hidden patterns, clusters, and relationships, paving the way for customer segmentation, anomaly detection, and more.
Whether it’s distinguishing cakes from ice creams or grouping animals based on their characteristics, machine learning algorithms have become our intelligent companions. They analyze vast amounts of data, unveiling secrets and delivering valuable insights that shape our understanding of complex phenomena.
So, whether you’re tackling real-world problems like spam filtering, customer segmentation, or predicting happiness scores, understanding the differences between supervised and unsupervised learning is the first step towards harnessing the true potential of machine learning. And it’s no brainer, that we’ll be hearing about these terms a lot more.
If you liked this read, and want to learn & pursue a career in Machine Learning, then GUVI’s offers IIT-M certified Artificial Intelligence & Machine Learning Course. The program follows a structured-vetted curriculum, designed to make you acquainted with a broad and detailed introduction to Machine Learning and Deep Learning. The Program will help you become a Machine Learning Expert in just 6 Months with Placement Assistance. The goal of this course is to help Students/working professionals upskill and equip themselves with the skills required to build and deploy Machine Learning models in production using Cloud.
Frequently Asked Questions
Supervised learning relies on labelled data, where the algorithm is trained to predict a target variable or make accurate classifications. Unsupervised learning, on the other hand, operates on unlabeled data, seeking to uncover patterns and structures without predefined labels.
Supervised learning enables applications like email spam filtering, image classification, and credit scoring, where accurate predictions are vital. Unsupervised learning finds its use in customer segmentation, image segmentation, anomaly detection, and association rule learning, providing valuable insights and uncovering hidden patterns.
Both supervised and unsupervised learning can handle large datasets, but the complexity may increase with data size. Scalability is an important consideration, and various techniques and algorithms are employed to ensure efficient processing and analysis of large datasets.






![How to Restore Old Photos with Deep Latent Space Translation: A Beginner’s Guide [2025] 17 deep latent space translation](https://www.guvi.in/blog/wp-content/uploads/2025/07/How-to-Restore-Old-Photos-with-Deep-Latent-Space-Translation.png)
![What is the Minerva Deep Learning Model? An Exclusive Beginner’s Guide [2025] 18 minerva](https://www.guvi.in/blog/wp-content/uploads/2025/07/A-Beginners-Guide-to-Data-Visualization-with-Matplotlib.png)


![What is Object Detection? A Beginner’s Guide [2025] 22 object detection](https://www.guvi.in/blog/wp-content/uploads/2025/07/What-is-Object-Detection_-A-Beginners-Guide.png)

Did you enjoy this article?