
4 Types of Data: Nominal, Ordinal, Discrete, Continuous
Jan 29, 2025 6 Min Read 42908 Views
(Last Updated)
In the ever-evolving landscape of data science, understanding the types of data is foundational to extracting meaningful information and insights. In its myriad forms, data serves as the backbone of decision-making processes across industries, making its classification crucial.
These types range from quantitative data, capturing numbers and quantities, to qualitative data, which focuses on descriptive and conceptual aspects. Familiarizing yourself with these types of data, including nominal data, ordinal data, discrete data, and continuous data, enriches your analytical capabilities, enabling more precise and informed decisions.
This article delves into the types of data in data science, offering a clear distinction between qualitative and quantitative data, categorical data, and the differences between nominal and ordinal data, as well as discrete and continuous data.
Table of contents
- What are the different types of data?
- A) Qualitative or Categorical Data
- B) Quantitative Data
- A. Qualitative or Categorical Data
- Differentiating Categorical Data Types
- Nominal Data
- What is Nominal Data?
- Examples and Applications
- Significance in Data Analysis
- Ordinal Data
- What is Ordinal Data?
- Examples and Applications
- Comparison with Nominal Data
- B. Quantitative Data
- Understanding Quantitative Data
- Discrete Data
- What is Discrete Data?
- Examples and Applications
- Role in Quantitative Analysis
- Continuous Data
- What is Continuous Data?
- Examples and Applications
- Benefits in Data Analysis
- Comparison with Discrete Data
- Takeaways...
- FAQs
- What are the primary categories of data science?
- How many categories of data exist in statistical analysis?
- What do the terms nominal, ordinal, and discrete signify in data types?
What are the different types of data?
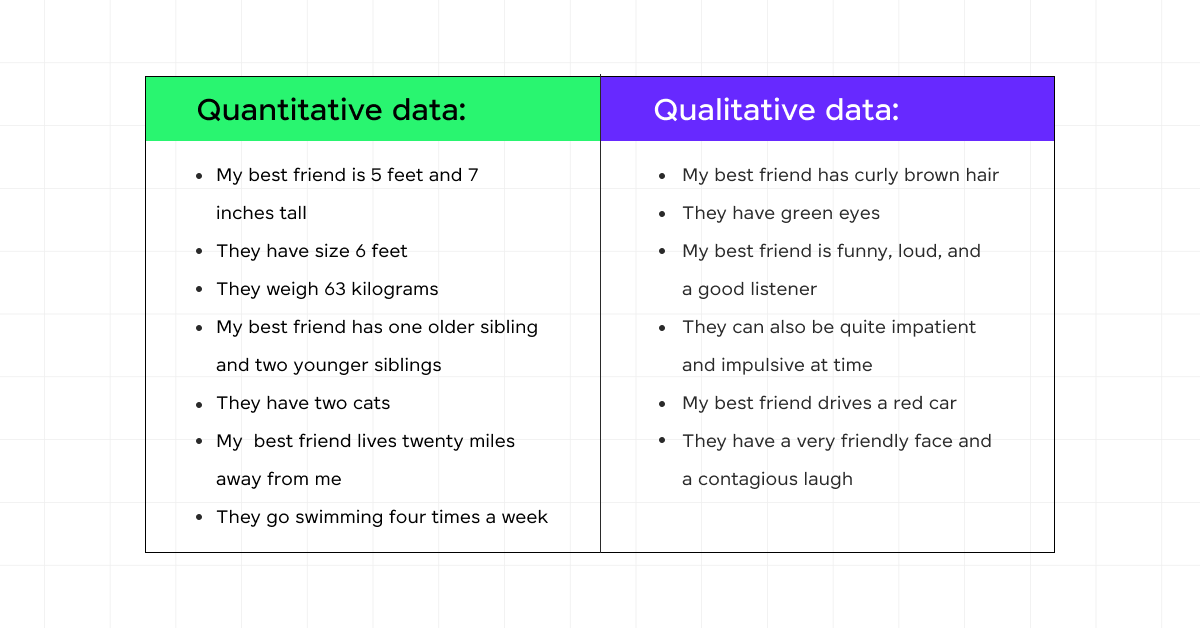
In data science, data is primarily classified into four distinct types, each with unique characteristics and uses. Understanding these types will help you effectively analyze and apply data in various contexts.
A) Qualitative or Categorical Data
This type of data is descriptive and cannot be measured in numbers. It is often divided into two categories:
- Nominal Data
- Definition: Data that is used for labeling variables without any quantitative value.
- Example: Gender, Nationality, Color.
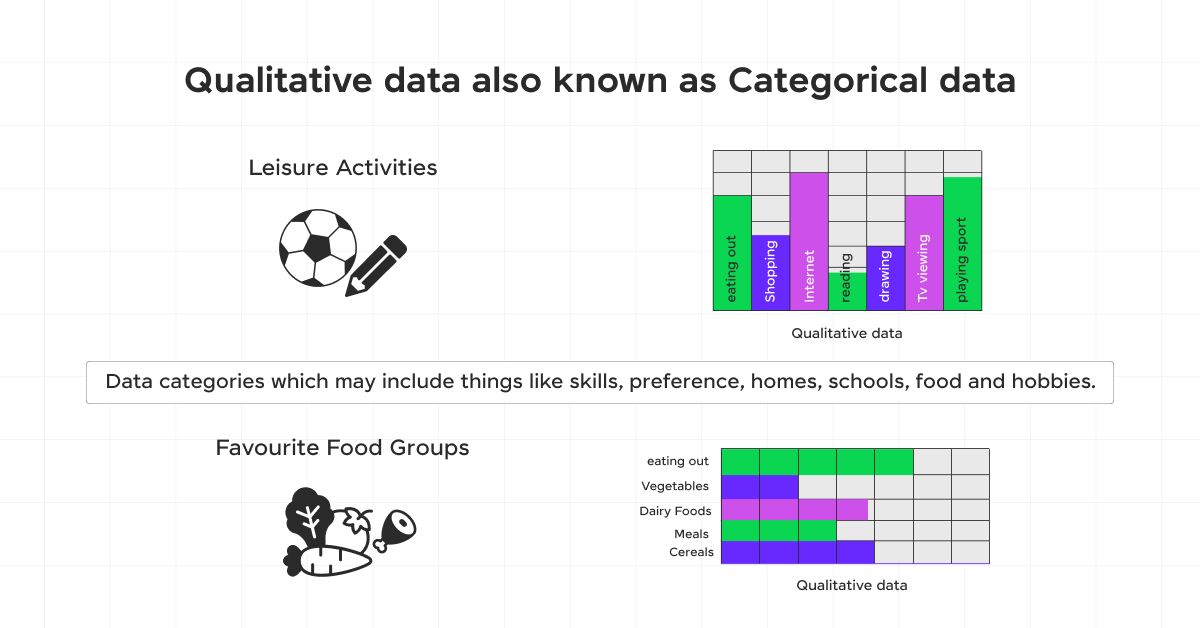
- Ordinal Data
- Definition: Data that involves order or ranking.
- Example: Ratings (good, better, best), Education level (high school, college, university).
B) Quantitative Data
Quantitative data is numerical and can be measured. This category also splits into two types:
- Discrete Data
- Definition: Data that can only take certain values and cannot be made more precise.
- Example: Number of students in a class, Number of cars in a parking lot.
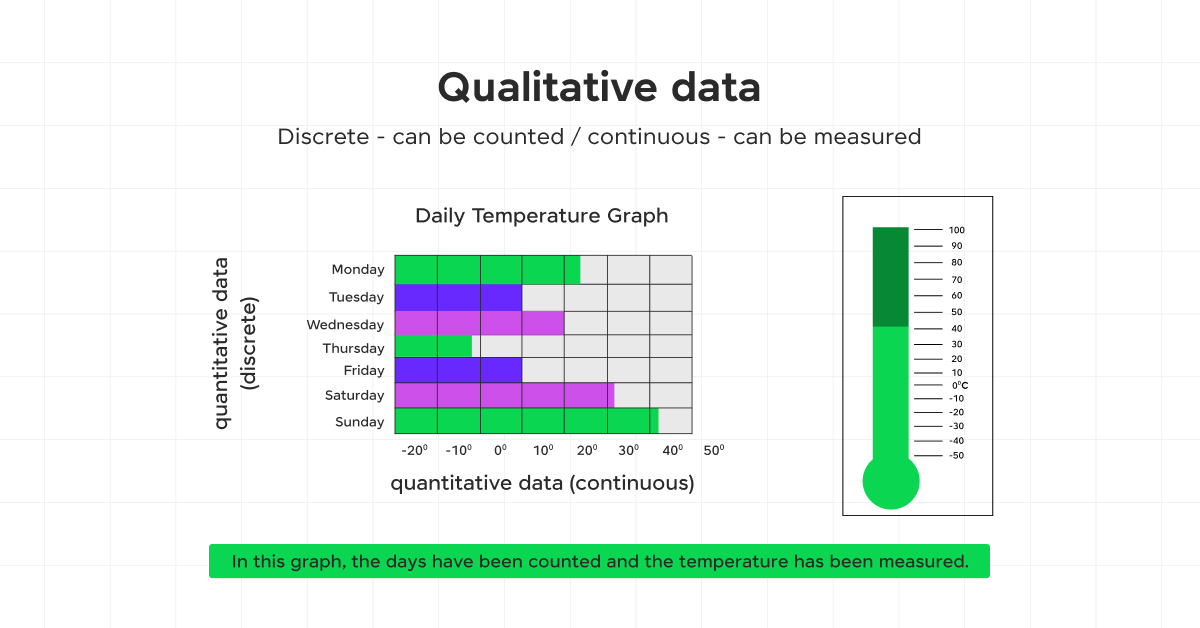
- Continuous Data
- Definition: Data that can take any value within a given range.
- Example: Height, Weight, Temperature.
To further clarify these types, a differentiation table is provided below:
| Data Type | Qualitative/Categorical | Quantitative |
|---|---|---|
| Nominal Data | Labels, No order | – |
| Ordinal Data | Labels with Order | – |
| Discrete Data | – | Fixed Values |
| Continuous Data | – | Range of Values |
Each type of data plays a crucial role in data analysis, and understanding the differences is key to selecting the right statistical methods and tools for your data science projects.
Before we move into the next section, ensure you have a good grip on data science essentials like Python, MongoDB, Pandas, NumPy, Tableau & PowerBI Data Methods. If you are looking for a detailed course on Data Science, you can join GUVI’s Data Science Course with Placement Assistance. You’ll also learn about the trending tools and technologies and work on some real-time projects.
Additionally, if you would like to explore Python through a Self-paced course, try GUVI’s Python course.
A. Qualitative or Categorical Data
Categorical data, pivotal in statistical analysis, encompasses variables converted into categories. This data type, derived from qualitative analysis, is countable or grouped within specific intervals.
It’s essential for representing characteristics such as a person’s gender or hometown, where measurements are expressed in natural language rather than numbers.
Interestingly, while categorical data can occasionally take numerical forms, these numbers lack mathematical significance, highlighting their non-quantitative nature.
To determine if data is categorical or numerical, consider if you can calculate an average. If not possible, it’s categorical, indicating its utility in non-numerical analysis.
Categorical data is best visualized through bar graphs or pie charts, offering a clear representation of data distribution across different categories.
Also Explore: Our highly popular Python Learner’s Hub, to master Python.
Differentiating Categorical Data Types
Categorical data splits into two main types: nominal and ordinal data. Nominal data labels variables without a numerical value and includes no inherent order.
For instance, categories like colors or countries fall under nominal data. On the other hand, ordinal data presents a natural order but does not allow for the quantification of differences between categories.
Examples include education levels or customer satisfaction ratings, where the sequence implies a progression.
Now, let us learn about the 2 types of qualitative data: nominal and ordinal.
1. Nominal Data
What is Nominal Data?
Nominal data, a fundamental type of qualitative data, is used primarily to label or name variables without imparting numeric values.
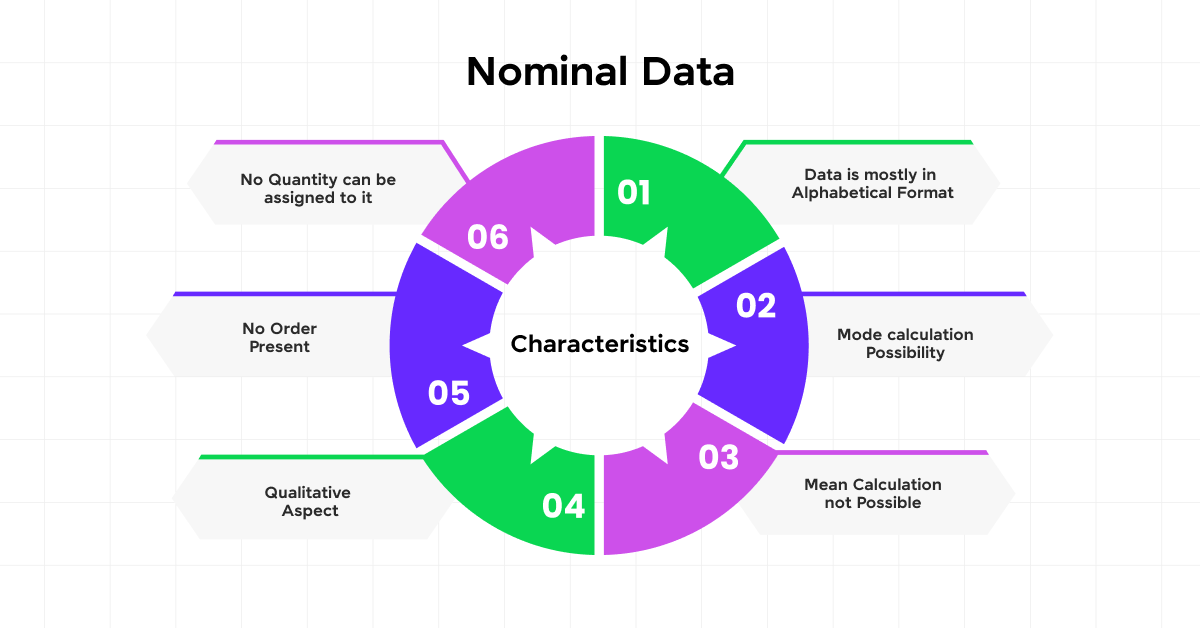
This simplest form of measurement categorizes variables into distinct, non-overlapping groups. Unlike other data types, nominal data lacks an inherent order or measurable distance between its categories, and it does not adhere to a true zero value.
It’s crucial in fields requiring classification without quantitative analysis, such as identifying different species in biology or categorizing various types of government in political science.
Examples and Applications
- You often encounter nominal data in everyday situations. For example, when you specify your hair color (black, brown, grey, blonde) or select your preferred mode of public transport (bus, tram, train), you are providing nominal data.
- These categories are exclusive and descriptive, serving as identifiers without any quantitative significance. In surveys, nominal data can be gathered through questions that offer a set list of options.
- For instance, a survey might ask, “Which state do you live in?” followed by a drop-down list of states, or “What is your employment status?” with options like employed, unemployed, or retired.
Also Read: 9 Best Data Science Projects with Source Code
Significance in Data Analysis
In data analysis, nominal data’s primary value lies in its ability to segment and organize information categorically.
This data type is useful for statistical analysis, marketing strategies, and demographic studies where understanding the distribution of categories is more relevant than measuring or comparing numerical values.
For example, marketers might analyze nominal data to determine the most popular product colors or features among different demographic groups, enabling targeted marketing strategies.
Nominal data is typically visualized using bar charts or pie charts, which effectively display the frequency distribution of categories.
2. Ordinal Data
What is Ordinal Data?
Ordinal data classifies variables into categories that have a natural order but where the distances between the categories are not necessarily uniform or known.
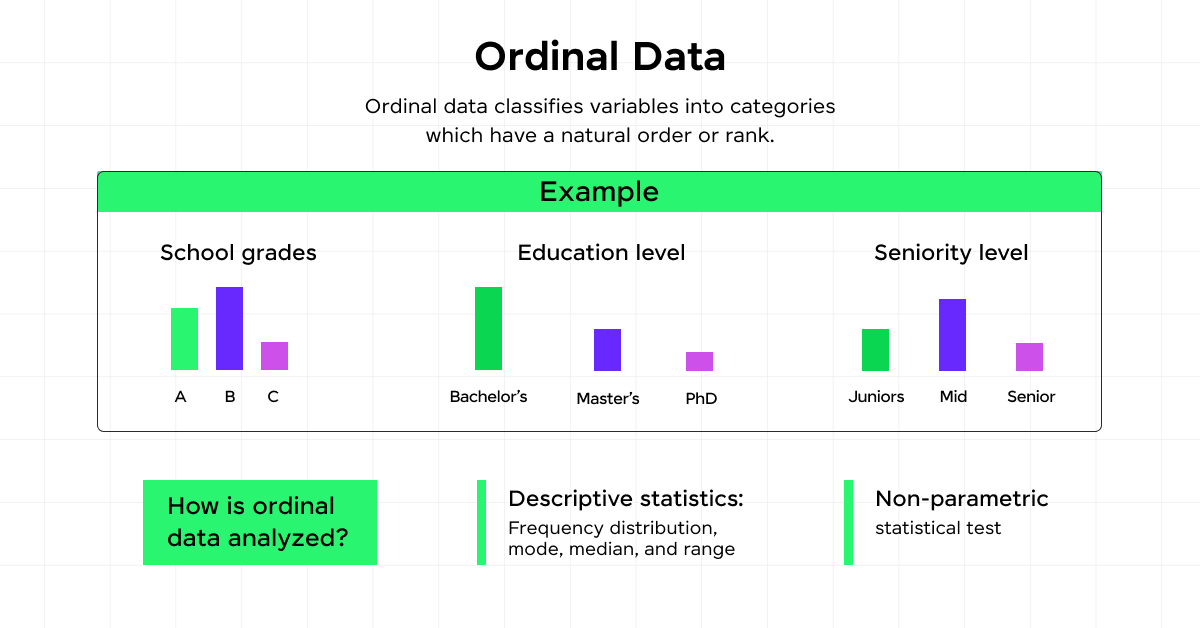
This type of data is often seen in scenarios where ranking is possible but the exact difference between ranks is not quantifiable.
It’s a step above nominal data, which involves categories without any order, and below interval data, where the differences between values are evenly spaced.
Examples and Applications
- You commonly encounter ordinal data in everyday situations and professional settings. For instance, in surveys, you might be asked to rate your satisfaction on a scale from 1 to 5, where each number represents a level of satisfaction from ‘very dissatisfied’ to ‘very satisfied’.
- These scales are ordinal because they convey an order—higher numbers mean more satisfaction. However, the difference in experience between consecutive numbers isn’t necessarily the same.
- Other examples include classifying economic status (low, medium, high), or levels of education (high school, college, university).
- Ordinal data is extensively used in market research and healthcare. It helps in assessing consumer preferences and patient outcomes respectively, where responses are categorized into ordered levels.
- This data type is pivotal in statistical analysis, especially in non-parametric statistics which do not assume data distribution patterns.
Comparison with Nominal Data
| Aspect | Nominal Data | Ordinal Data |
|---|---|---|
| Definition | Categories with a meaningful order or ranking. | Categorizes with a meaningful order or ranking. |
| Examples | Types of fruit (e.g., apple, banana, cherry). | Student grades (e.g., A, B, C, D, F). |
| Numerical Coding | Typically not coded numerically. | Can be coded numerically (e.g., 1 for ‘Never’ to 5 for ‘Always’). |
| Mathematical Operations | No meaningful arithmetic operations. | Supports basic comparisons (greater or less than), but not meaningful arithmetic operations. |
B. Quantitative Data
Quantitative data encompasses information that can be quantified and expressed numerically, making it essential for statistical analysis and mathematical calculations.
This type of data answers questions like “how many” and “how often,” providing a clear, measurable insight into various phenomena.
Understanding Quantitative Data
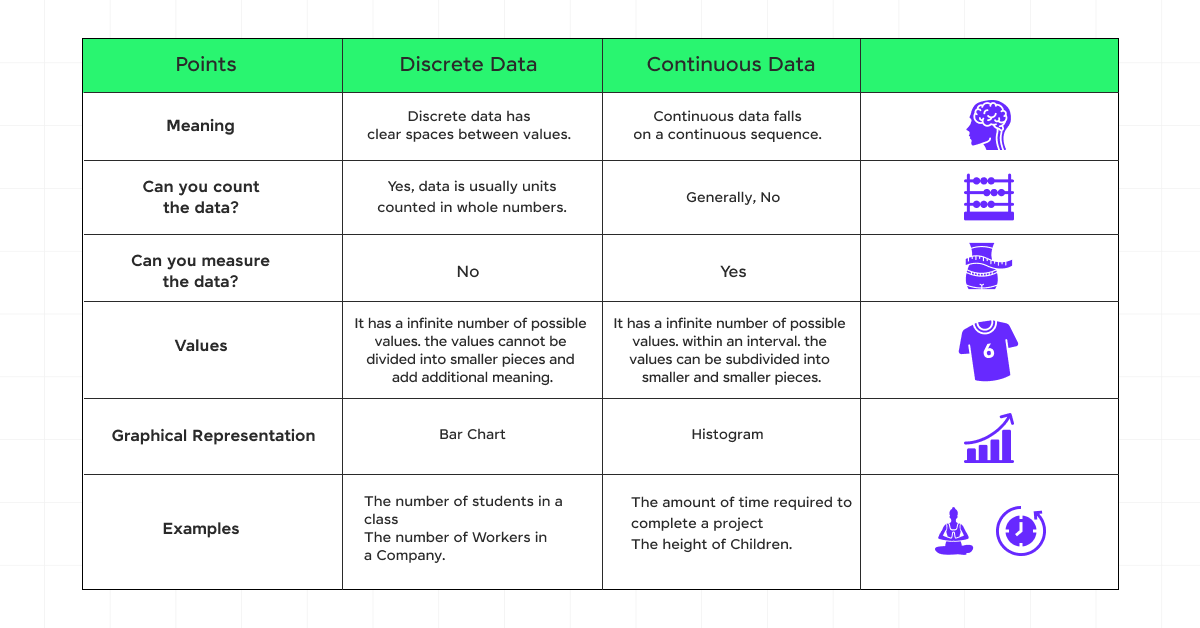
Quantitative data can be broadly classified into two types: discrete and continuous data. Discrete data represents counts that can only assume specific values with gaps in between, such as the number of students in a classroom.
Continuous data, however, can assume any value within a given range, like temperature or height, offering infinite possibilities.
Now let us learn about the 2 types of quantitative data: discrete and continuous.
3. Discrete Data
What is Discrete Data?
Discrete data consists of countable values, limited to whole numbers or integers, and cannot be subdivided into smaller parts.
This type of data fits into specific categories and is essential for various types of statistical analysis because it is straightforward to summarize and compute.
Examples and Applications
- You encounter discrete data frequently in everyday life and professional environments.
- For instance, the size of your department’s workforce, the number of new clients acquired in a quarter, or the inventory count in your stockroom are all examples of discrete data.
- This data is typically visualized using bar graphs, which effectively represent the countable nature of the data.
- In marketing, discrete data aids in demographic analysis and helps in understanding consumer behavior by categorizing data into different demographic variables like age, income, and education level.
Get your basics right with What is Data Science? Important Factors to Learn Before Getting Started [2024]
Role in Quantitative Analysis
Discrete data plays a pivotal role in quantitative analysis as it provides precise counts that are essential for statistical calculations.
It is often used in simple statistical analyses like frequency distributions, where data is organized against single values.
This type of data is particularly useful in scenarios where data points are distinct and separate, such as the number of tickets sold per day or the number of students attending a class.
The clear, countable nature of discrete data makes it invaluable for making informed decisions based on quantitative facts.
4. Continuous Data
What is Continuous Data?
Continuous data refers to numerical data that can take on any value within a given range, representing measurements that can vary infinitely within two points.
This type of data is characterized by its precision, often including decimal points to provide exact measurements.
Common tools such as stopwatches, scales, and thermometers are used to collect these precise measurements, making continuous data essential for detailed and accurate analysis in fields like science and engineering.
Examples and Applications
- Continuous data is utilized extensively across various domains for its ability to provide detailed and accurate information.
- For example, daily wind speeds, freezer temperatures, and the weight of newborn babies are all instances of continuous data.
- In sports analytics, tracking the exact times of runners in events like the Olympics demonstrates the application of continuous data, where even a millisecond can be crucial.
- This data type is also vital in manufacturing for ensuring product specifications like box dimensions and weights are met.
Benefits in Data Analysis
The analysis of continuous data offers several advantages, particularly in terms of precision and depth of information. It enables more accurate calculations such as averages, standard deviations, and correlations, leading to more insightful predictions and decisions.
Continuous data supports a wide range of statistical techniques, including regression analysis, which allows for a deeper understanding of relationships between variables.
This increased accuracy and analytical depth facilitate better decision-making in fields ranging from healthcare to business analytics, where nuanced data interpretation is critical for success.
Comparison with Discrete Data
| Aspect | Discrete Data | Continuous Data |
|---|---|---|
| Definition | Represents countable items, often in whole numbers. | Represents measurable quantities that can take any value within a range. |
| Examples | Number of students in a class, number of cars in a parking lot. | Height of students, time taken to run a race. |
| Numerical Representation | Values are distinct and separate (e.g., 0, 1, 2, 3). | Values can be any number within a given range (e.g., 5.4, 7.25, 9.0). |
| Mathematical Operations | Can perform arithmetic operations like addition and counting. | Supports a wide range of mathematical operations, including addition, subtraction, multiplication, and division. |
Kickstart your Data Science journey by enrolling in GUVI’s Data Science Course where you will master technologies like MongoDB, Tableau, PowerBI, Pandas, etc., and build interesting real-life projects.
Alternatively, if you would like to explore Python through a Self-paced course, try GUVI’s Python course.
Takeaways…
Having explored the essential facets of data types in data science—including nominal, ordinal, discrete, and continuous data—our journey underscores the foundational role that understanding these types plays in harnessing data’s full potential.
Through the differentiation between quantitative and qualitative data, and further, between discrete and continuous as well as nominal and ordinal data, we have illuminated the paths for applying these categorizations in real-world analytics.
The significance of these data types extends beyond mere academic interest, permeating various industries where data-driven decisions dictate progress.
FAQs
Data science incorporates various methodologies and tools, primarily categorized into four types: descriptive, inferential, predictive, and prescriptive.
There are four categories of data in statistical analysis: Nominal, Ordinal, Discrete, and Continuous.
Nominal, Ordinal, and Discrete are specific types of data used to categorize different methods of quantification and analysis. Nominal data is categorized without a natural order or ranking, Ordinal data involves order but not fixed intervals, and Discrete data consists of distinct and separate values.


![10 Impressive Data Visualization Project Ideas [With Source Code] 9 Data Visualization Project Ideas](https://www.guvi.in/blog/wp-content/uploads/2024/11/best_data_visualization_project_ideas_with_source_code_.webp)






Hello! This article has helped me a lot. I'm a slow learner but i've understood the contents in one read. thank you soo much and keep up the exemplary work you are doing. Unakaa mwalimu mzuri sana.
no coment
I really enjoyed reading this article as i am learning data analysis for the first time… Your article helped me clear my queries. Easy to understand.daily life examples makes it more practical to understand.