
What is Business Analytics? A Comprehensive Guide 2025
Feb 01, 2025 6 Min Read 1181 Views
(Last Updated)
Organizations that use data to make decisions are 23 times more likely to acquire customers and 6 times more likely to retain them. Making business decisions without proper analytics resembles walking in complete darkness.
Business analytics converts raw data into practical insights that help you make smarter choices for your organization. Small startups and large enterprises need to understand the simple aspects of business analytics to stay competitive in today’s market. Companies that use analytics will achieve 5-6% higher productivity rates than their competitors.
This detailed guide explains what is business analytics, its core components, implementation strategies, and benefits for your business. You will discover the vital tools, methodologies, and ground applications in various industries to build a resilient analytics framework for your organization.
Table of contents
- What is Business Analytics?
- Key Components and Architecture
- Data Processing Pipeline
- How Business Analytics Works
- Business Analytics vs Business Intelligence
- Core Business Analytics Methodologies
- 1) Statistical Analysis Techniques
- 2) Machine Learning Applications
- 3) Predictive Modeling Approaches
- Implementation of Analytics Tools and Technologies
- 1) Data Visualization Platforms
- 2) Analytics Software Solutions
- 3) Cloud-based Analytics Services
- Benefits of Business Analytics
- Business Analytics Applications
- 1) Retail and E-commerce Applications
- 2) Financial Services Use Cases
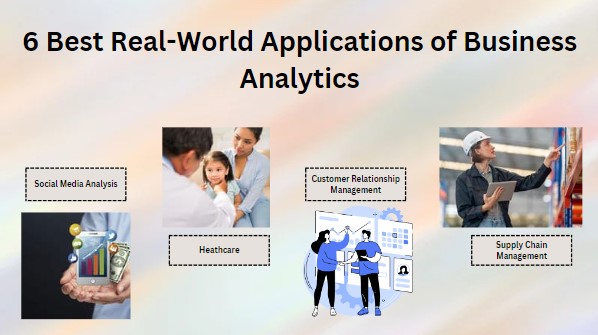
- 3) Healthcare Analytics Solutions
- Takeaways…
- FAQs
- Q1. What are the key components of business analytics?
- Q2. How does business analytics benefit organizations?
- Q3. What are the core methodologies used in business analytics?
- Q4. How is business analytics implemented across different industries?
- Q5. What considerations are important when building a robust analytics framework?
What is Business Analytics?
Business analytics explores organizational data through statistical methods and technologies to help make better decisions. It works like a GPS for your business that guides you through complex data to reach the best outcomes.
Key Components and Architecture
The business analytics framework has several connected components:
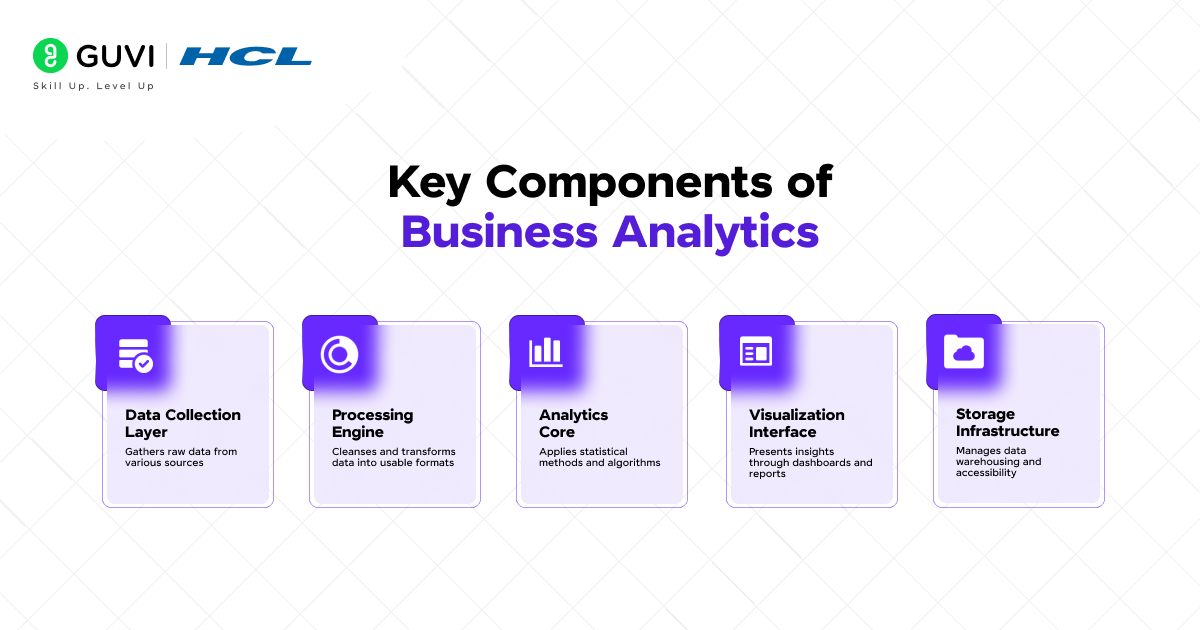
- Data Collection Layer: Gathers raw data from various sources
- Processing Engine: Cleanses and transforms data into usable formats
- Analytics Core: Applies statistical methods and algorithms
- Visualization Interface: Presents insights through dashboards and reports
- Storage Infrastructure: Manages data warehousing and accessibility
Data Processing Pipeline
Data flows through the analytics pipeline in a well-laid-out path. Raw data comes in through collection points that capture both structured and unstructured information. The data goes through cleaning and validation to ensure accuracy.
The processed data then moves through different analytical stages:
- Descriptive analysis to understand what happened
- Diagnostic analysis to determine why it happened
- Predictive analysis to forecast future trends
- Prescriptive analysis to recommend actions
How Business Analytics Works
Business analytics combines statistical techniques and applied mathematics to help you make better decisions. Your analytics experience starts when you collect and analyze database information to learn about your business performance.
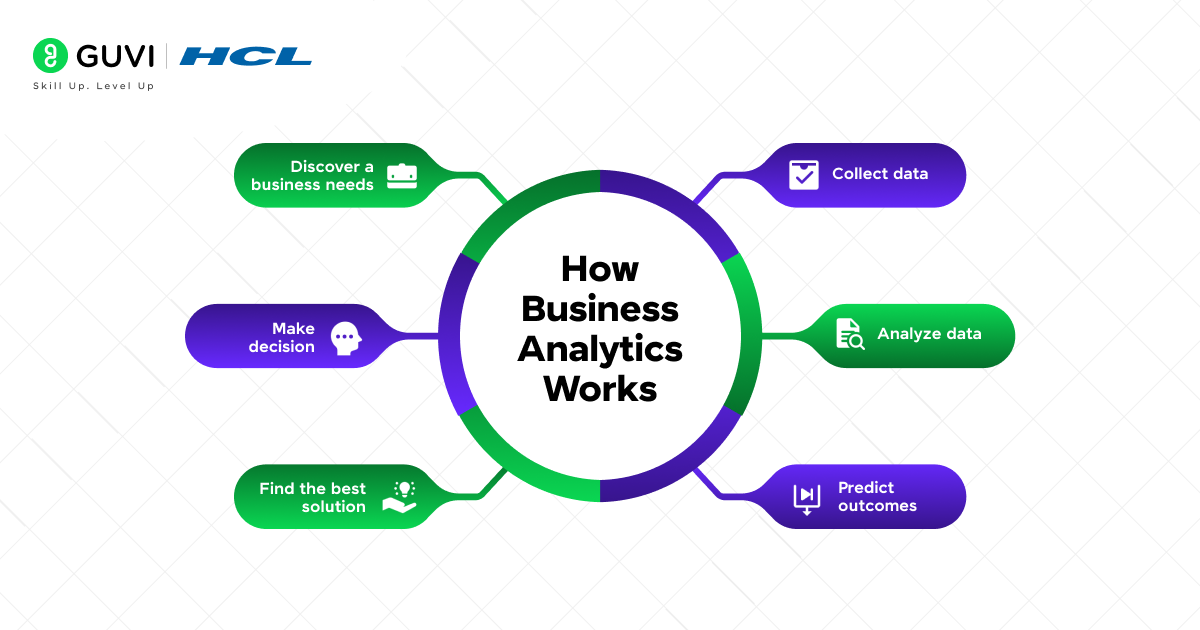
After understanding what business analytics is, let’s now understand how it works. Business analytics works through four distinct types:
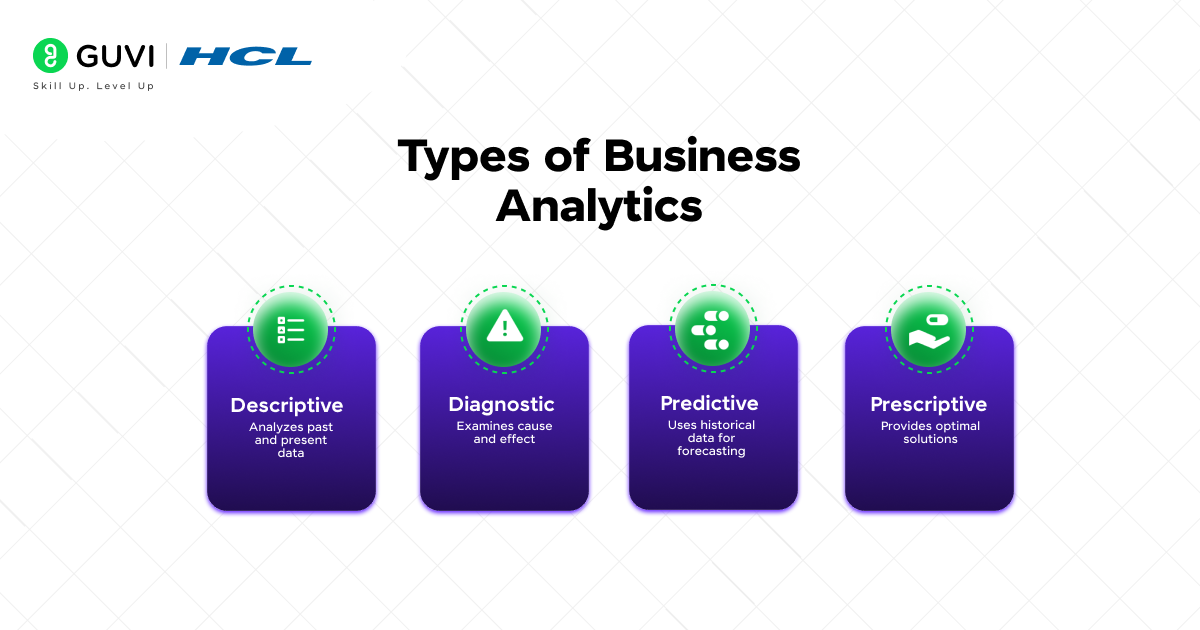
| Analytics Type | Purpose | Key Feature |
| Descriptive | Analyzes past and present data | Shows what happened |
| Diagnostic | Examines cause and effect | Explains why it happened |
| Predictive | Uses historical data for forecasting | Projects what might happen |
| Prescriptive | Provides optimal solutions | Suggests what should be done |
Your business analytics process begins with combined analysis, which works well to describe populations and compare segments. This first step helps you understand how customers behave and market trends.
The method uses statistical techniques to improve your:
- Sales strategies and policy making
- HR planning and financial activities
- Product pricing decisions
- Customer relationship management
Business analytics helps you solve about 80% of your business problems at a fraction of the cost of complex analytics. The process excels at finding patterns and connections that create business value.
You need good quality data and integration for successful analytics implementation. The process uses data visualization to handle complex data in various formats that traditional systems can’t process. This helps you find meaningful patterns and make evidence-based decisions that line up with your business goals.
Business Analytics vs Business Intelligence
The terms Business Analytics (BA) and Business Intelligence (BI) are often used interchangeably, yet they serve distinct purposes in data-driven decision-making. While both focus on leveraging data to enhance business outcomes, their methodologies, tools, and goals diverge significantly.
BA emphasizes predicting future trends and prescribing optimal strategies, while BI focuses on analyzing historical data to provide insights into past and present performance. Understanding these differences is critical for organizations aiming to adopt the right tools and techniques to meet their strategic and operational needs.
The table below explores the distinctions between BA and BI, highlighting their complementary roles in modern businesses:
| Aspect | Business Analytics (BA) | Business Intelligence (BI) |
| Definition | Focuses on predictive and prescriptive analysis to forecast trends and optimize strategies. | Emphasizes descriptive analysis, analyzing past and current data for insights. |
| Objective | Aims to drive strategic decisions by predicting future scenarios. | Helps monitor performance and make informed decisions based on historical data. |
| Approach | Forward-looking, focusing on “what will happen” and “what should be done.” | Backward-looking, addressing “what happened” and “why it happened.” |
| Key Techniques | Predictive modeling, statistical analysis, optimization, machine learning. | Reporting, dashboards, data visualization, and querying tools. |
| Data Processing | Processes real-time and dynamic data for agile responses. | Works primarily with structured, historical data stored in databases. |
| Primary Tools | Advanced tools like SAS, IBM Watson, and RapidMiner; integrates AI and machine learning. | BI platforms like Power BI, Tableau, and Qlik Sense for data visualization. |
| Decision-Making Focus | Enhances decision-making by exploring multiple future scenarios. | Supports decisions by presenting clear trends and performance metrics. |
| Target Users | Analysts and strategists who focus on forecasting and optimization. | Executives and managers monitoring business performance and KPIs. |
| Integration with AI | Leverages AI and deep learning for complex data analysis and enhanced predictions. | Rarely integrates AI; focuses on presenting data in accessible formats. |
| Use Cases | Market trend analysis, resource optimization, customer segmentation, and risk management. | Performance tracking, sales reporting, and operational efficiency analysis. |
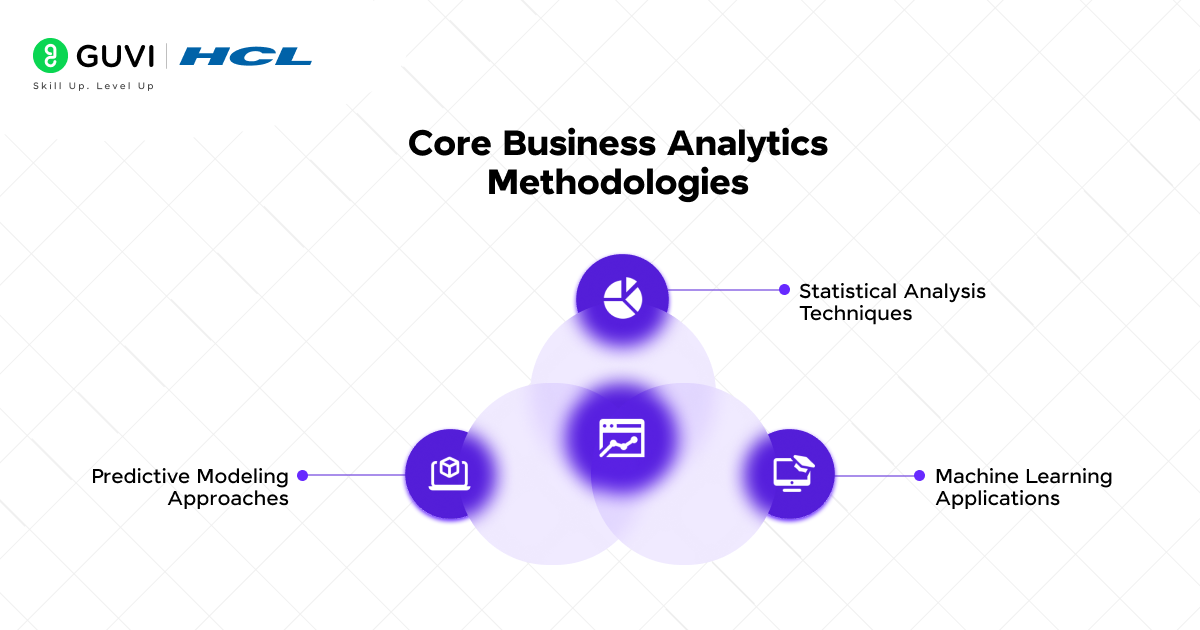
Core Business Analytics Methodologies
You need to realize the full potential of your business analytics strategy by becoming skilled at three core methodologies. These methodologies are the foundations of modern analytics.
1) Statistical Analysis Techniques
The statistical analysis toolkit starts with hypothesis testing. This helps you confirm business assumptions and make informed decisions. Market trends and customer behavior analysis benefit greatly from single variable linear regression. This method proves valuable for forecasting outcomes based on historical data.
| Statistical Method | Business Application |
| Hypothesis Testing | Validate business theories |
| Linear Regression | Sales and revenue forecasting |
| Multiple Regression | Complex scenario prediction |
2) Machine Learning Applications
Machine learning improves your analytics capabilities automatically. It learns and gets better from experience without explicit programming. Your ML-powered analytics can:
- Provide informed insights with reduced bias
- Boost analyst productivity through automated data analysis
- Generate contextual visualizations with automated commentary
3) Predictive Modeling Approaches
Your predictive modeling strategy should use both classification and regression models to forecast future outcomes effectively. These models might vary in complexity but share one goal: turning historical data into practical insights.
Neural network models help analyze complex patterns within high volumes of activities. The implementation of predictive analytics requires proper data preparation and quality control to achieve reliable results.
Time series analysis helps identify trends and cycles over time. This knowledge leads to better decisions about inventory management and resource allocation. All the same, your predictive modeling success depends on data quality, variable selection, and model assumptions.
Master Business Analytics with GUVI’s Business Analyst Course, designed to equip you with in-demand skills like data visualization, business intelligence, and problem-solving through real-world projects.
Gain expertise in tools like Excel, SQL, and Tableau while mastering industry-relevant concepts to kickstart a thriving career in business analytics. Start your journey to becoming a certified Business Analyst with personalized mentorship and hands-on training.
Implementation of Analytics Tools and Technologies
The right analytics tools can change how your business makes use of data. Modern analytics platforms provide sophisticated features that go beyond simple reports.
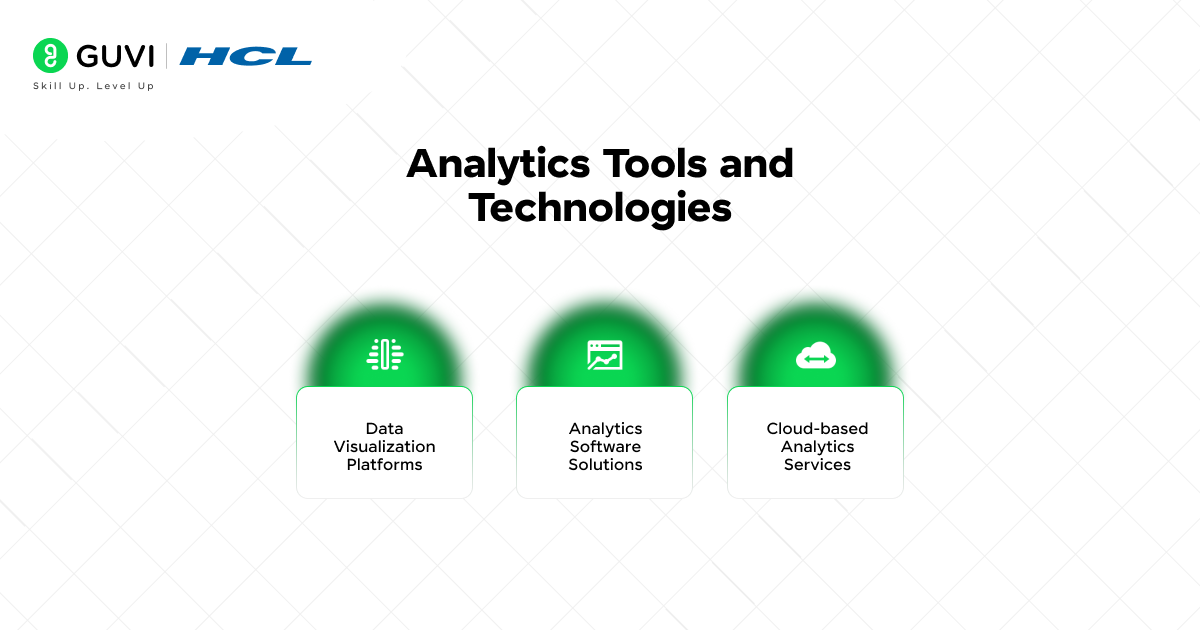
1) Data Visualization Platforms
Data visualization tools help turn complex data into compelling stories. Tableau excels at data visualization with a user-friendly drag-and-drop interface that creates interactive dashboards. The platform connects to data sources ranging from spreadsheets to complex databases, which helps teams create dynamic visualizations for better decisions.
2) Analytics Software Solutions
Power BI stands out as a strong solution, particularly because it works well with Microsoft’s ecosystem. Teams can expand their analytics through:
- Up-to-the-minute data analysis for quick insights
- AI-driven analytics to detect patterns
- Cross-platform access for team collaboration
| Tool | Key Strength | Best For |
| Tableau | Data Storytelling | Visual Analytics |
| Power BI | Microsoft Integration | Enterprise Solutions |
| Looker | SQL Database Analysis | Custom Analytics |
3) Cloud-based Analytics Services
Cloud analytics moves data processing and storage to secure cloud environments. Organizations benefit from:
- Computing resources that grow with needs
- Direct access to analytics tools
- Quick data processing capabilities
- Better security through cloud infrastructure
Good analytics software solves access problems by providing constant access to current data online. Cloud-based solutions are now vital for businesses that want to stay competitive through data-driven decisions.
Benefits of Business Analytics
Business analytics brings significant returns to organizations. Research shows companies that use analytics see an 8% revenue increase and cut costs by 10%.
Analytics implementation offers these main benefits:
- Better market forecasts and trend predictions
- Simplified operational processes
- Evidence-based risk management
- Better customer experience optimization
- Smart resource allocation
Analytics shows what worked and what didn’t in your past operations. This knowledge helps you make accurate estimates about financial performance and customer needs.
| Benefit Category | Impact Metrics |
| Revenue Growth | 6% average profit increase |
| Cost Reduction | 10% operational savings |
| Efficiency Gain | 5-6% higher productivity |
- Your risk management becomes stronger with better forecasting. Analytics helps spot and reduce financial, supply chain, and logistics risks by predicting bottlenecks or material shortages. You can take action before problems grow bigger.
- Analytics makes customer experience optimization more accurate. You learn more about shopping priorities and satisfaction levels by analyzing transaction data, social media interactions, and IoT device information. This helps create individual-specific experiences and targeted marketing campaigns.
- Analytics proves its worth by measuring new strategies and marketing campaign results. You can spot areas where resources might be wasted and allocate them more effectively.
- The benefits grow over time. Organizations that keep investing in analytics for five years see their profit increases jump from 6% to 9%. This long-term value comes from knowing how to make better decisions based on accumulated data and insights.
Business Analytics Applications
Business analytics reshapes how organizations operate and compete in a variety of sectors. Let’s look at its applications and how different industries use analytics to gain competitive advantage.
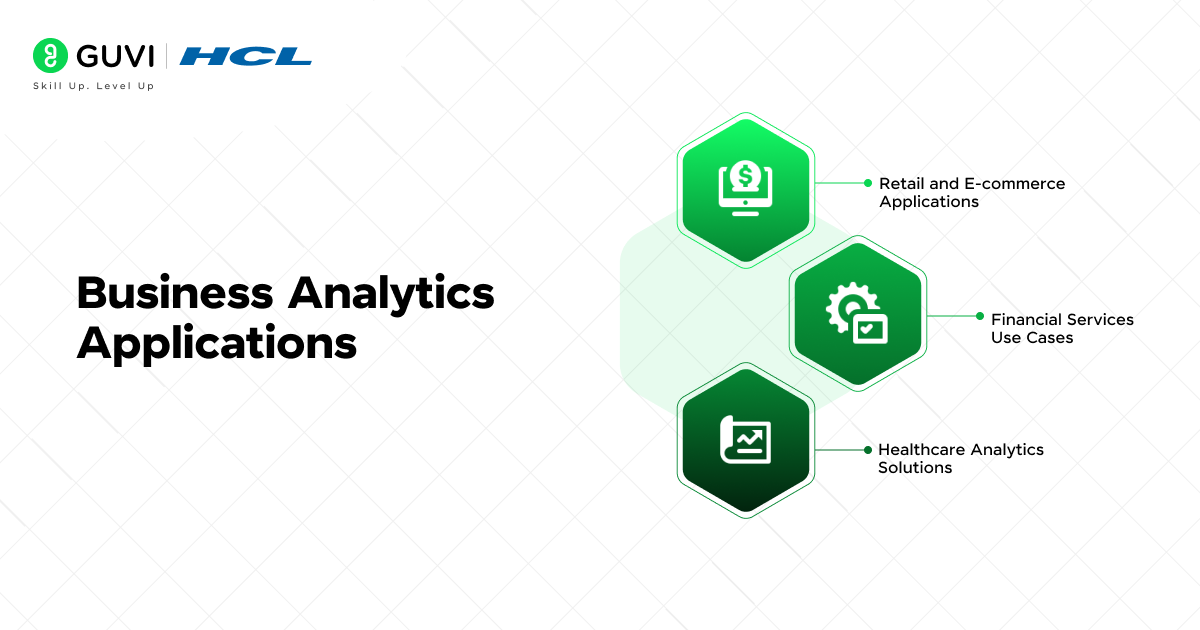
1) Retail and E-commerce Applications
Understanding customer behavior patterns forms the foundation of retail analytics. Retailers who used AI-powered analytics in the last year cut product development lifecycles by 50% and reduced costs by 30%.
Notable applications in retail include:
- Inventory optimization through predictive demand forecasting
- Dynamic pricing strategies based on market conditions
- Customer segmentation for targeted marketing
- Supply chain efficiency improvements
2) Financial Services Use Cases
Analytics implementation plays a vital role in the financial sector. The largest global banks (82%) now employ advanced analytics platforms. These institutions use data science to:
| Application Area | Primary Function |
| Risk Assessment | Credit scoring and fraud detection |
| Market Analysis | Live trading insights |
| Customer Service | Individual-specific banking solutions |
| Compliance | Regulatory reporting automation |
3) Healthcare Analytics Solutions
Your healthcare analytics strategy can boost patient outcomes and optimize operations effectively. Healthcare providers have successfully applied analytics in several ways.
Healthcare analytics primarily improves patient care quality while reducing costs. To cite an instance, one U.S. health system cut pneumonia readmissions by 21% through informed interventions.
The healthcare sector benefits from better patient outcomes and simplified service delivery. Your organization can use healthcare data to create practical insights that improve patient outcomes while boosting your bottom line.
Takeaways…
Business analytics is a vital driver of organizational success in 2025 and beyond and hence it is very important to understand what business analytics is. The trip through analytics implementation begins with core components and builds reliable frameworks that ensure success over time.
Organizations using data achieve substantially better results. Companies that implement analytics see 8% higher revenues and 10% reduced operational costs. Better decision-making capabilities improve results in business functions of all sizes.
Business analytics revolutionizes operations in industries of all types – from retail and e-commerce to healthcare and financial services. These tools and techniques help position organizations to grow and gain competitive advantage in a business environment driven by data.
FAQs
Business analytics comprises data collection, processing, analysis, and visualization. It includes a data processing pipeline that cleanses and transforms raw data, applies statistical methods, and presents insights through dashboards and reports. A robust analytics infrastructure also requires scalable computing resources, data warehouses, and security protocols.
Business analytics offers numerous benefits, including enhanced market forecasting, streamlined operations, data-driven risk management, and improved customer experience optimization. Companies using analytics report an average 8% increase in revenues and a 10% reduction in costs. It also enables more accurate financial estimates and helps in measuring the success of new strategies and marketing campaigns.
The core methodologies in business analytics include statistical analysis techniques like hypothesis testing and regression analysis, machine learning applications for automated data analysis, and predictive modeling approaches. These methods help in forecasting outcomes, identifying trends, and making data-driven decisions across various business functions.
Business analytics is widely implemented across industries such as retail, financial services, and healthcare. In retail, it’s used for inventory optimization and dynamic pricing. Financial institutions use it for risk assessment and market analysis. In healthcare, analytics drives improvements in patient care quality and operational efficiency, with one U.S. health system reducing pneumonia readmissions by 21% through data-driven interventions.
When building a robust analytics framework, key considerations include data governance and security, scalability, and performance optimization. It’s crucial to implement comprehensive security measures, consider cloud-based solutions for scalability, and optimize performance through efficient data pipelines and effective caching mechanisms. These elements ensure that your analytics framework can adapt to growing business needs while maintaining data integrity and providing real-time insights.







Did you enjoy this article?