Learn to Upgrade 10X times as a Data Science
logo

Master in Data Science Skills

Grow 10X Bundle

Become proficient in the Top 10 Data Science technologies. Master fundamental concepts and key techniques to shape a robust and rewarding professional future.

Enroll Now & Get Flat 80% OFF!

₹9999 ₹1999/-

Master in Data Science Skills

Become proficient in the Top 6 Data Science technologies. Master fundamental concepts and key techniques to shape a robust and rewarding professional future.

Enroll Now & Get Flat 80% OFF!

₹9999 ₹1999/-

Master in Data Science Skills

Become proficient in the Top 6 Data Science technologies. Master fundamental concepts and key techniques to shape a robust and rewarding professional future.

Enroll Now & Get Flat 80% OFF!

₹9999 ₹1999/-

Kickstart Your Learning Today!
Name*
Phone number*
Please fill all the required fields!
Please accept terms and conditions to proceed

With 7 days refund policy*

Unmatched Benefits for You

Individual certifications

Individual Certifications

Total Learners

Total Mentors

Total Learners

Recorded Content

One time Purchase

Individual Certifications

Total Learners

Total Mentors

Total Learners

Doubt Clarification

In All Modules

Individual Certifications

Total Learners

Total Mentors

Total Learners

Refund Policy

Individual Certifications

Recorded Content (100% Online)

One time Purchase

Doubt Clarification

In All Modules

Refund Policy

Unmatched Benefits for You

Individual certifications

Individual Certifications

Total Learners

Total Mentors

Total Learners

Recorded Content 
(100% Online)

One time Purchase

Individual Certifications

Total Learners

Total Mentors

Total Learners

Doubt Clarification

In All Modules

Individual Certifications

Total Learners

Total Mentors

Total Learners

Refund Policy

Why Data Science is the Key to a Prosperous Career?

Excel in the Job Market with our Data Science Mastery Bundle!

25K+

Job Openings by 2024 in India (Top 5 trending technology)

₹8.5 LPA

Average salary of a Data Scientist in India (Glassdoor)

36%

Growth of data science from 2021 to 2031 (Payscale)

A foundational understanding of Web-development Ecosystem 

Clearly explained videos by vetted web developers. 

Learn how to develop fast, responsive & interactive websites

Use of trending technologies like - Flask, Redis & Machine Learning. 

Effectively implement machine learning concepts in web development.

How to write functional yet seamless JavaScript Code.

Build fully working web applications using simple steps.

Start your Data Science Upskilling Journey

Upskill and Invest in a Glowing Data Science Career

Master and gain 6 certifications @ ₹1999 only

Transform into an advanced data science professional from a beginner. Learn from a curated selection of self-paced, upskilling courses with detailed modules offering expert guidance.

Tableau Desktop Certification
Advanced Data Visualisation using PowerBI
Data Visualization using Excel
Web scraping
Data Wrangling : Mastering Data preparation and Analysis
Tableau Introduction to Beginners
Computational Thinking
Modern HTML & CSS
Machine Learning
Redis & Python RESTful API

Upskill and Invest in a Glowing Data Science Career

Master and gain 6 certifications @ ₹1999 only

Transform into an advanced data science professional from a beginner. Learn from a curated selection of self-paced, upskilling courses with detailed modules offering expert guidance.

Tableau Desktop Certification
Advanced Data Visualisation using PowerBI
Data Visualization using Excel
Web scraping
Data Wrangling : Mastering Data preparation and Analysis
Tableau Introduction to Beginners

Enrich Your CV with Global Certifications

  • Certificates are issued by an edtech company GUVI.
  • Certificates are globally recognized & they upgrade your programming profile.
  • Certificates are generated after the completion of course.
  • Certificates are sharable on your LinkedIn profile
  • Certificates are issued by an edtech company GUVI.
  • Certificates are globally recognized & they upgrade your programming profile.
  • Certificates are generated after the completion of course.
  • Certificates are sharable on your LinkedIn profile

From Fundamentals to Expertise

After this Course, You’ll be Able to

Master Python for effective implementation in Data Science projects.

Apply statistical programming for practical implementation in Data Science tasks.

Integrate Data Science insights seamlessly with advanced PowerBI visualisation skills.

Cultivate computational thinking for adept problem-solving in real-world scenarios.

Harness MongoDB expertise for efficient NoSQL database management in Data Science.

Acquire proficiency in machine learning to build and train diverse models.

Achieve Your Career Goals with This Course

Learn from scratch, make a career switch, or simply upgrade your skills, this course is everything you need if you’re a 

How Does Data Science Combo Course Work?

Unlock your Data Science Pack post-payment

Unlock your Ethical Hacking Pack post-payment

Unlock your Ethical Hacking Pack post-payment

Sign Up/Log in to your GUVI account

Access and learn courses in 'My Courses' section

Complete individual courses and gain certifications

Unlock your Data Science Pack post-payment

Sign Up/Log in to your GUVI account

Complete individual courses and gain certifications

Access and learn courses in 'My Courses' section

Why Choose GUVI?

We are most trusted vernacular ed-tech company delivering world-class learning experiences by providing highly effective & finest learning solutions, breaking the language barrier in tech learning for more than 2 million learners worldwide.

2M+
Total Learners
190+ 
Total Mentors

Total Learners

Total Mentors

Total Learners

10M+
Lines of code submission
1600+
Videos

Total Learners

Total Mentors

Total Learners

Total Learners

Total Mentors

Lines of code submission

Videos

4.4

Accredited by

What Our Learners say about Us?

"You will be lucky to find quality courses on GUVI. I must say that I was really lucky to get courses at such a low and discounted price. I got more than 9 hours of video and around 20 more resources to gain knowledge of programming. GUVI provides a wide variety of courses both technical and non-technical. I suggest GUVI is the best choice."

"What makes GUVI different is that it provides vernacular courses which make it easy to understand & practice platforms like CodeKata & WebKata, all these helped me improve my practical programming skills in the front end, back end. I highly recommend it if you want to get started with something new."

"I have opted for a combo-course that starts with the basics of the popular technologies and made me a pro in its domain... Codekata is very damn helpful to crack placements because it improved my efficiency in coding... we just need to be persistent and that’s all it takes. I am very happy to encounter GUVI!"

Get Unlimited Access to Exclusive Practice Platforms

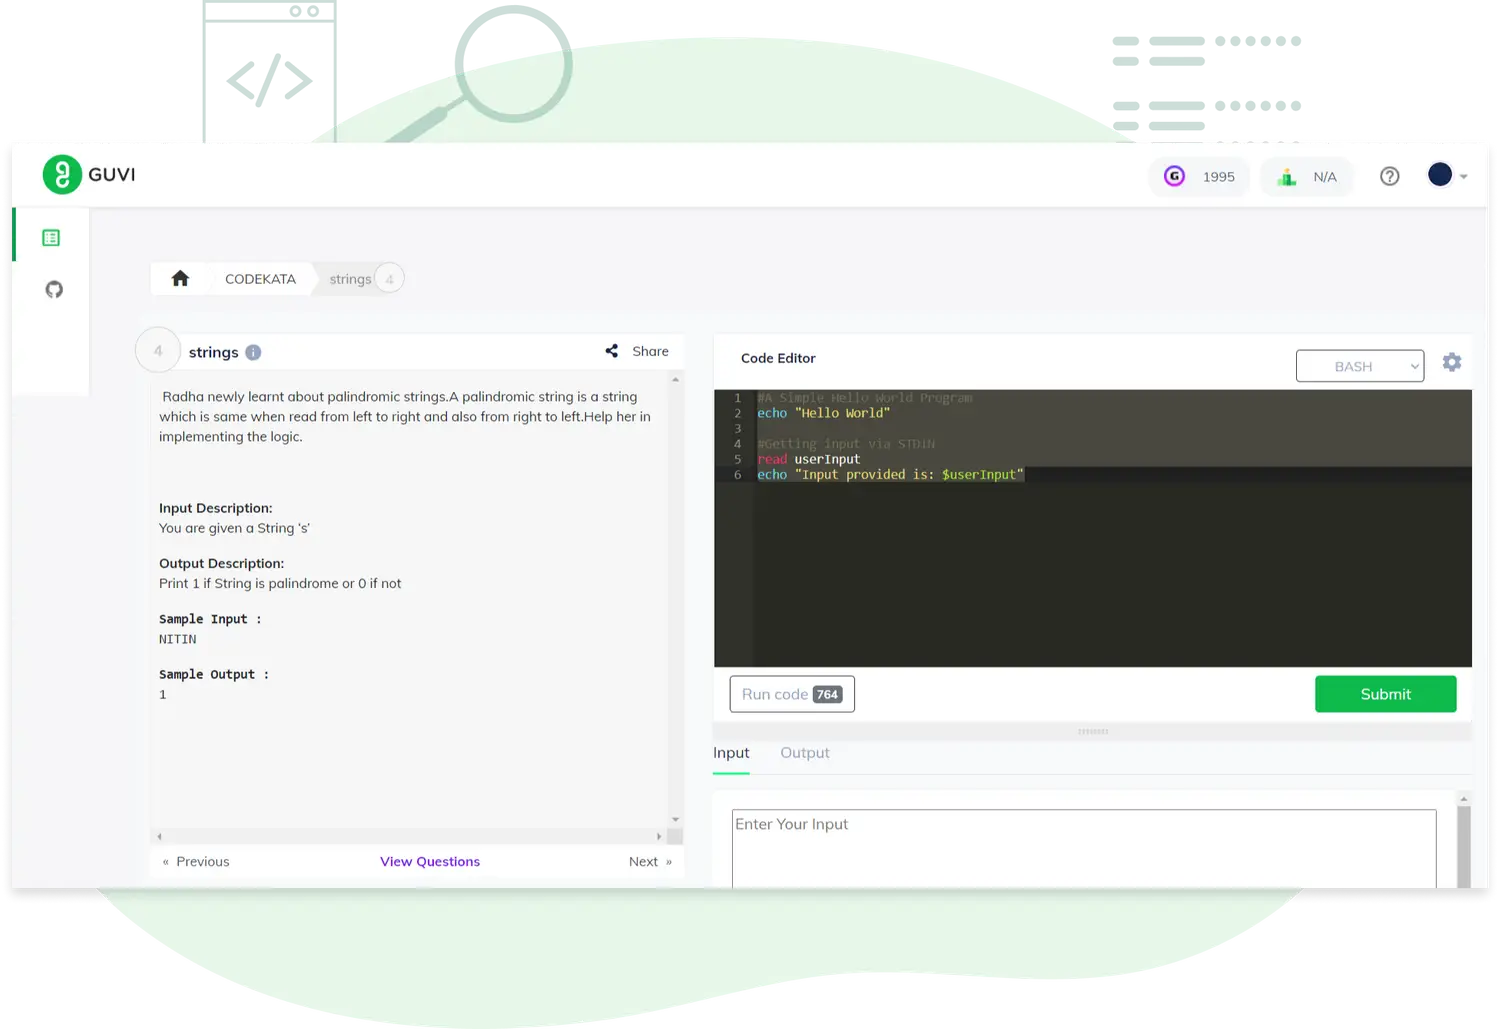
CodeKata

A tool-kit specifically developed to boost the coding skills and makes you ever-ready to crack interviews.

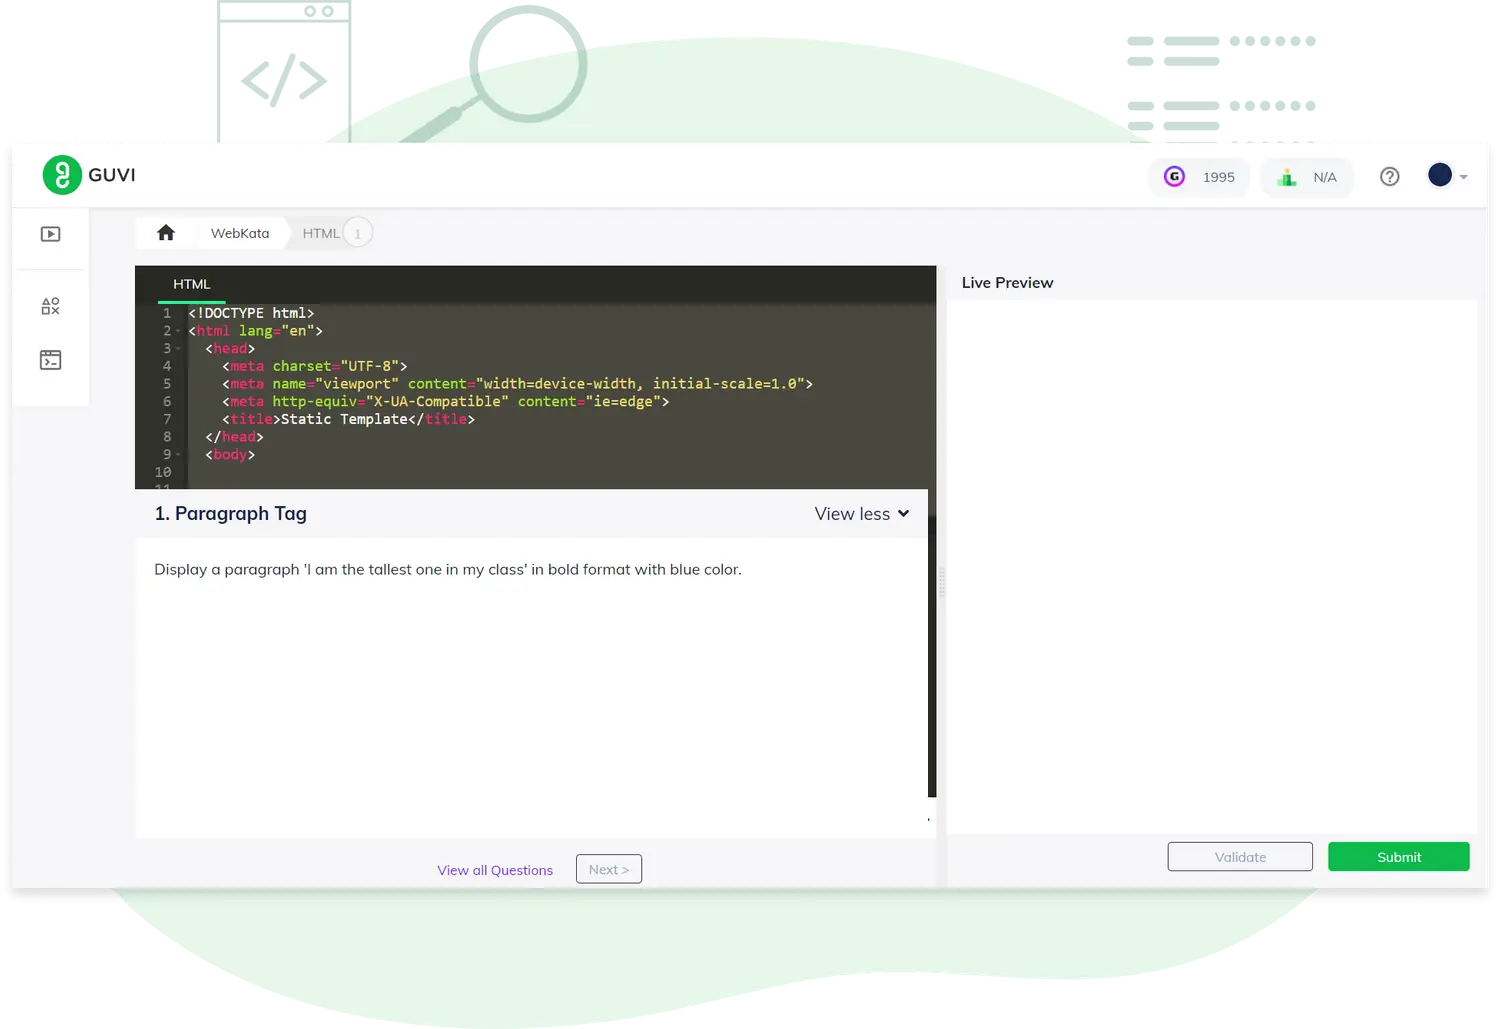
WebKata

A cloud-based module to hone your front end skills without any hassle of local environment setup.

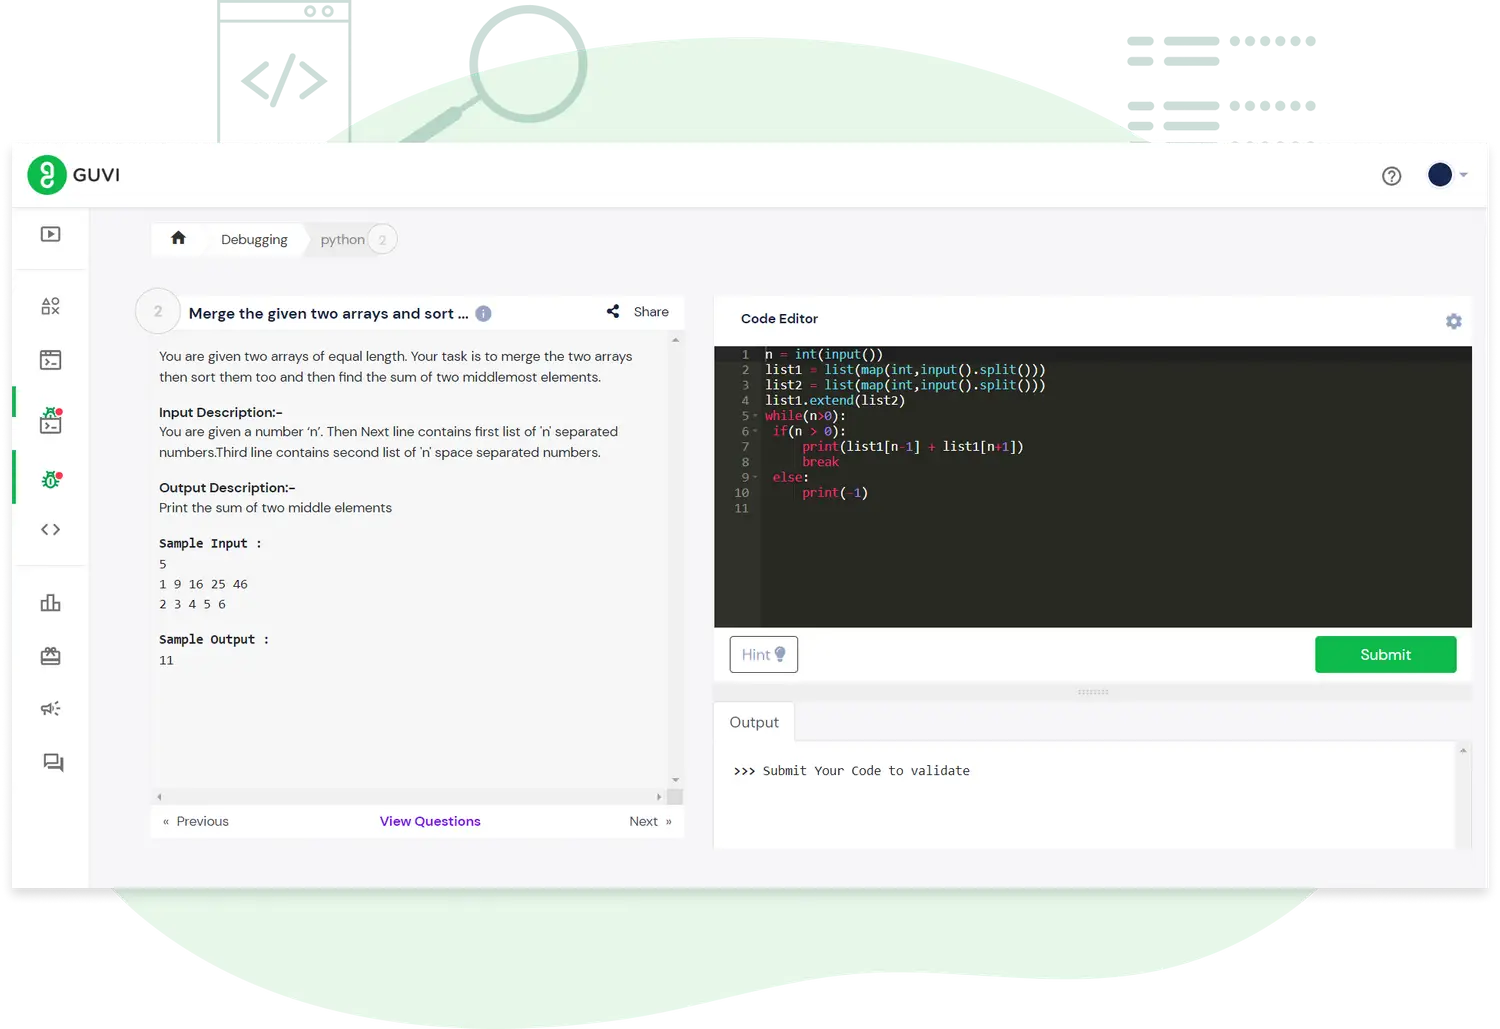
Debugging

Practising on Debugging will help you get started and be familiarised with programming.

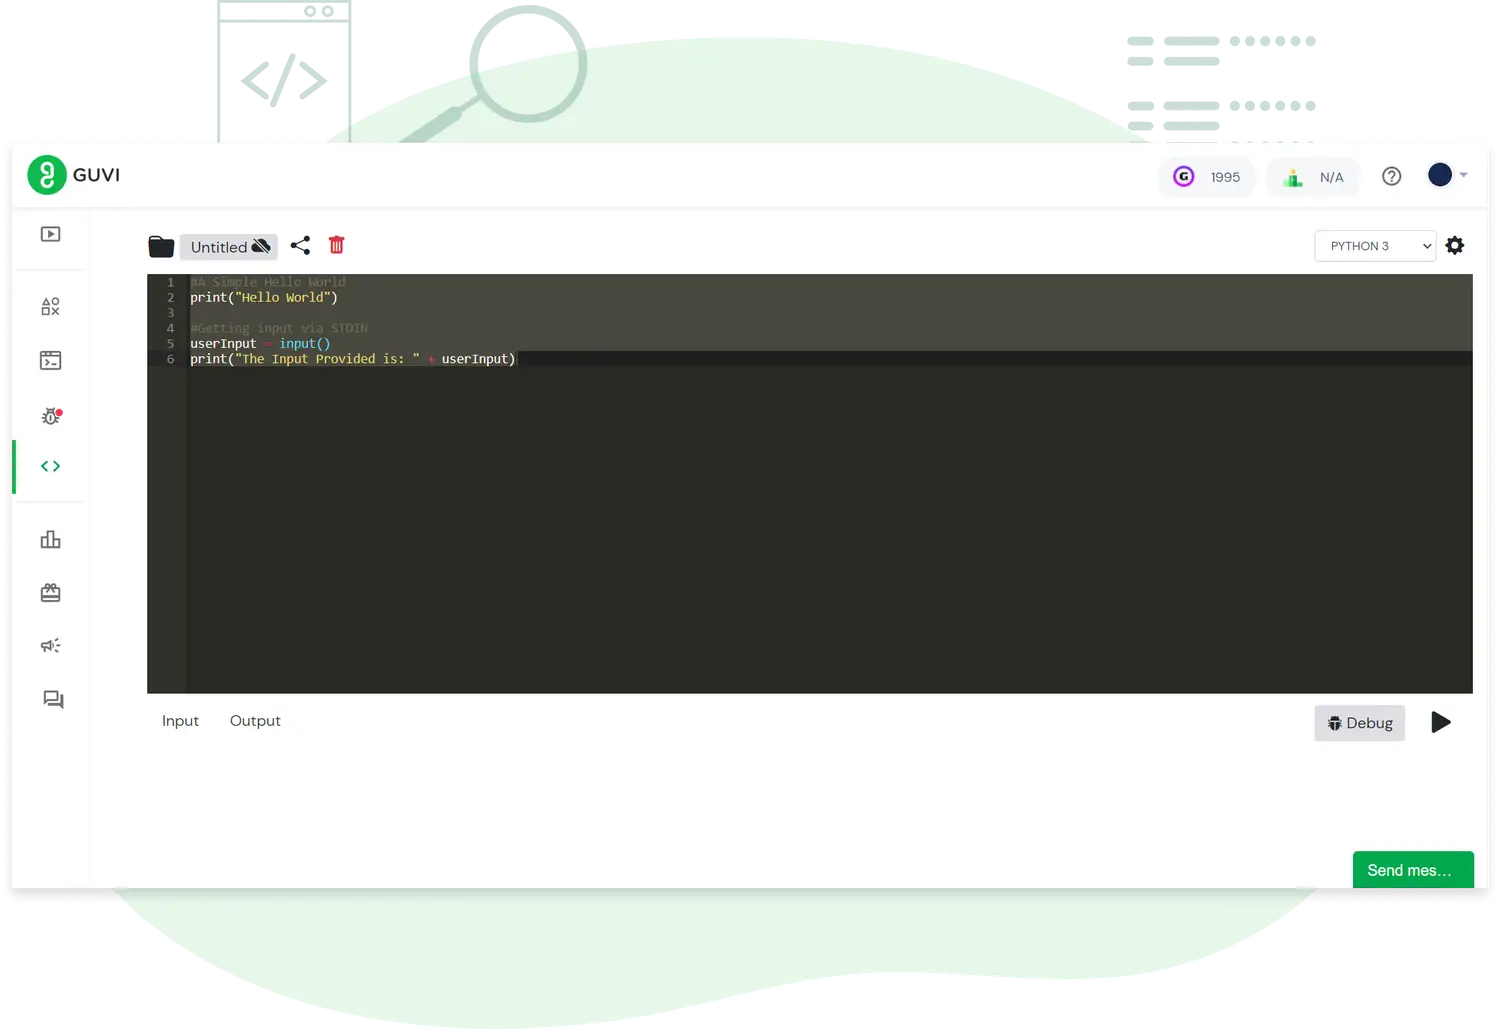
IDE

GUVI IDE is an Integrated Development Environment that lets you write, edit, run, test & debug your code. 
Frequently Asked Questions

What is the refund policy?

Customer satisfaction is our first priority. If you are not satisfied with the course, send a mail to [email protected] with the reason for refund and your feedback on the course, within 7 days of purchasing the course. Your refund will be processed immediately. 

Apart from these courses, will I get access to any practice platforms?

You will gain full access to CodeKata - a gamified practice platform which hosts 1000+ curated coding problems, Webkata - a gamified practice platform for Web problems, Debugging - A practise Platform to practise debugging problems and IDE - an Integrated Development Environment that lets you write, edit, run, test & debug your code. 

Is it 100% online learning or should I come in person for any specific course?

It is a 100% online learning course package and there won’t be any necessity for you to be present in person. 

Will I gain access to any sort of Forum support?

Yes. You will gain complete access to our forum support to connect with our fellow aspiring users. 

On what basis are the certificates rolled out?

The certificates are rolled out as and when you complete a course. 

When can I start learning? Or what is the duration of this course?

All 10 courses in the package offer 100% online, self-paced learning. This means you can start and finish each course at your own convenience based on your timeline, schedule, and availability. Once purchased, you get lifetime access and unlimited learning whenever and wherever you want it.

Master Data Science Skills

Buy 6 courses @ ₹1999 only 

With 7 days refund policy*

With 7 days refund policy*

Tableau Desktop Certification
Syllabus:
Beginner Module
  • Introduction about the course and about myself(Preview video)
  • Introduction to Tableau
    Tableau Desktop Specialist Certification Overview
  • Tableau Desktop Basics - Part 1
  • Tableau Desktop Basics - Part 2
  • Connecting to and Preparing Data - Part 1
  • Connecting to and Preparing Data - Part 2
  • Connecting to and Preparing Data - Part 3
  • Manage Data Model and Data Properties - Part 1
Intermediate Module
  • Manage Data Model and Data Properties - Part 2
  • Manage Data Model and Data Properties - Part 3
  • Create basic charts - Part 1
  • Create basic charts - Part 2
  • Create basic charts - Part 3
  • Create basic charts - Part 4
  • Create basic charts - Part 5
  • Create basic charts - Part 6
  • Create basic charts - Part 7
  • Create basic charts - Part 8
Advanced Module
  • Organize data and apply filters - Part 1
  • Organize data and apply filters - Part 2
  • Apply analytics to a worksheet - Part 1
  • Apply analytics to a worksheet - Part 2
  • Apply analytics to a worksheet - Part 3
  • Formatting with Tableau
Expert Module
  • Create and modify dashboards - Part 1
  • Create and modify dashboards - Part 2
  • Create and modify dashboards - Part 3
  • View and share workbook data
  • Understanding Tableau Concepts
  • Schedule your exam
  • Tableau Project - Part 1
  • Tableau Project - Part 2
  • Tableau Project - Part 3
  • Tableau Project - Part 4
Advanced Data Visualisation using PowerBI Syllabus:
Advance Module
  • Data Visualization & Its Importance
  • Data Visualization & Its Importance
  • Types Of Data & Levels of measurement
  • Describing Visuals for Qualitative & Quantitative Data
  • Know the right chart
  • Power BI Overview Interface & Importing Of Data
  • Understanding Superstore Data
  • Bar Charts
  • Column Charts
  • Line & Area Charts
  • Combo & Ribbon Charts
  • Waterfall & Funnel Charts
  • Scatter Charts
  • Pie & Donut Charts
  • Tree Map
  • Basic Maps, Filled Map & Azure Map
  • Shape Map, ArGIS Map along with tips to build right map
  • Gauge Charts
  • Cards, Multi-row card & KPI
  • Slicers
  • Tables & Matrix
  • Other Visuals in Power BI: Key Influencer & Decomposition tree
  • Other Visuals in Power BI: Metrics(Preview), Card(new), Power Apps, Power Automate & Smart narrative
  • Introduction to Data Model
  • Designing data model for superstore data-1
  • Designing data model for superstore data-2
  • Data Model Building in Power BI
  • Study about Relationships in Power BI-1
  • Study about Relationships in Power BI-2
  • Adding Calendar Table to data model
  • Additional relationship tools in Power BI
  • Overview of Power Query Editor
  • Using Append & Workbook method-to combine Excel Worksheets-1
  • Using Append & Workbook method-to combine Excel Worksheets-2
  • Combining Clean Excel Workbooks using a Folder
  • Combining un-clean Excel Workbooks using a folder
  • Merge Queries
  • Data Source & Refresh Settings
  • Setup to enable Python scripts in Power BI
  • Line Chart using Python script
  • Simple Visuals using Python script
  • Advanced Visuals using Python script
  • Setup to enable R script in Power BI
  • Custom Visuals using R script
  • Limitations to R & Python scripts in Power BI
    Different Custom Visuals in Power BI
  • Bookmarks
  • Drill Through
  • Buttons,shapes, images & Sync Slicers
  • Edit Interaction feature
  • Group, Include & Exclude feature
  • Customized Tooltip feature
  • Useful DAX Scenario's
  • Superstore Analysis Dashboard-1
  • Superstore Analysis Dashboard-2
  • Superstore Analysis Dashboard-3
  • Superstore Analysis Dashboard-4
  • Overview of Power BI Service
Data Visualization using Excel Syllabus:
Beginner Module
  • Basic Excel Functionalities & Merging data in excel
  • Table formatting and Conditional formatting
  • Advanced Conditional formatting
  • Advanced Excel Functions
  • Advanced Excel Functions (Part 2)
  • Searching and Filtering in data
  • Data cleaning using text functions
  • Styling Tabulation in Excel
Intermediate Module
  • Reading comlplex JSON files in Excel
  • Trendlines and Sparklines
  • Slicers and Pivot Table
  • Charts in Excel and Pivot Bar Chart
  • Clustered and Stacked Bar Charts
  • Box and Whisker Plot
  • Area Chart & Stacked Area Chart
  • Distribution of Data - Histogram
Advanced Module
  • Dual Axis (Combo Charts)
  • Scattered Plot
  • Linear Regression Chart
  • Pie Chart & Donut Chart
  • Gauge or Speedometer Chart using Donut Chart
  • Conditional Donut Progress Circle Chart
  • Sunburst & TreeMap Chart
  • WaterFall Chart
Expert Module
  • Gantt Chart
  • Bubble Chart
  • Funnel Chart
  • Map Chart
  • HeatMap Chart
  • Getting Ready (Dashboard - Part 1)
  • KPI Dashboard in Excel
  • Interactive Dashboards with Slicers
  • Conclusion
Web scraping Syllabus:
Beginner Module
  • Introduction to Web Scraping- Part 1
  • Introduction to Web Scraping- Part 2
  • Introduction to Web Scraping- Part 3
  • Introduction to Web Scraping- Part 4
  • HTML and CSS Basics- Part 1
  • HTML and CSS Basics- Part 2
  • HTML and CSS Basics- Part 3
Intermediate Module
  • Inspecting and exploring a website
  • Python Requests Module - HTTP Request Part 1
  • Python Requests Module - HTTP Request Part 2
  • Web Scraping from API- Part 1
  • Web Scraping from API- Part 2
  • Parsing HTML with BeautifulSoup- Part 1
  • Parsing HTML with BeautifulSoup- Part 2
  • Parsing HTML with BeautifulSoup- Part 3
  • BeautifulSoup live demo
Advance Module
  • Web Scraping with Scrapy
  • Selenium to Automate Web Browsers - Part 1
  • Selenium to Automate Web Browsers - Part 2
  • Selenium to Automate Web Browsers - Part 3
  • Selenium to Automate Web Browsers - Part 4
  • Selenium to Automate Web Browsers - Part 5
Expert module
  • Capstone Project - Part 1
  • Capstone Project - Part 2
  • Capstone Project - Part 3
  • Capstone Project - Part 4
  • Capstone Project - Part 5
Data Wrangling : Mastering Data preparation and Analysis Syllabus:
Beginner Module
  • Introduction to Data Wrangling - Part 1
  • Introduction to Data Wrangling - Part 2
  • Introduction to Data Wrangling - Part 3
  • Introduction to Data Wrangling - Part 4
  • Introduction to Data Wrangling - Part 5
  • Introduction to Data Wrangling - Part 6
  • Introduction to Data Wrangling - Part 7
  • Introduction to Data Wrangling - Part 8
  • Introduction to Data Wrangling - Part 9
  • Introduction to Data Wrangling - Part 10
  • Introduction to Data Wrangling - Part 11
  • Introduction to Data Wrangling - Part 12
Intermediate Module
  • Data Cleaning - Part 1
  • Data Cleaning - Part 2
  • Data Cleaning - Part 3
  • Data Cleaning - Part 4
  • Data Cleaning - Part 5
Advanced Module
  • Data Transformation - Part 1
  • Data Transformation - Part 2
  • Data Transformation - Part 3
  • Data Transformation - Part 4
  • Data Visualization - Part 1
  • Data Visualization - Part 2
  • Data Visualization - Part 3
  • Advanced Data Wrangling Techniques - Part 1
  • Advanced Data Wrangling Techniques - Part 2
  • Advanced Data Wrangling Techniques - Part 3
  • Advanced Data Wrangling Techniques - Part 4
Expert Module
  • Feature Selection
  • Capstone Project
  • Capstone Project
Tableau Introduction to Beginners Syllabus:
Beginner Module
  • Introduction to Tableau
  • Why Tableau?
  • Tableau Products & Installation
  • Connecting to Data and different Chart types
  • Data Types
  • Understanding Marks Card
  • When to Use Line Charts
  • Filtering & Groups
  • Dates as Hierarchical Dimensions
Intermediate Module
  • Trend Lines
  • Box Plots
  • Views using Sample Superstore Data - Part 1
  • Views using Sample Superstore Data - Part 2
  • Views using Sample Superstore Data - Part 3
  • Views using Sample Superstore Data - Part 4
  • Customizing & Sharing New Data in Tableau
  • Tableau Calculation Types
  • How to Write Calculations - Part 1
  • How to Write Calculations - Part 2
  • Tooltips
  • Doughnut Chart

Advanced Module
  • Date Hierarchies
  • Converting Discrete & Continuous Dates
  • Parameters - Part 1
  • Parameters - Part 2
  • Parameters - Part 3
  • Parameters - Part 4
  • Level of Detail (LoD) - Part 1
  • Level of Detail (LoD) - Part 2
  • Level of Detail (LoD) - Part 3
  • Introduction to Mapping
  • Working with Geographic Data
  • Shapes, Colors & Sizes
Expert Module
  • Custom Mapping Techniques
  • Custom Geocoding
  • Dual Layer Mapping
  • Dashboard Design Principles - Part 1
  • Dashboard Design Principles - Part 2
  • Important Considerations for Creating Dashboards
  • The Art of Storytelling
  • Storytelling & Neuroscience
  • Emotions & Storytelling
  • Setting Up the Story - Part 1
  • Setting Up the Story - Part 2
  • Setting Up the Story - Part 3
  • Building a Dashboard & an Interactive Story
  • Capstone Project
MongoDB Syllabus:
Beginner Module

Introduction to MongoDB
Setting Environment Variables
Start the mongo Shell
Creating Collections
Final Quiz

Intermediate Module

Creating and Dropping Documents
Query Document 
Query Document AND OR C
MongoDB Update Document
Final Quiz

Advanced Module

Delete Document
MongoDB Projection
Sort,Skip and Limit
Final Quiz

Expert Module

Indexing
MongoDB Aggregation
MongoDB Backup and Restore data
Final Quiz

Data Visualization in Python Syllabus:
Beginner Module
  • Introduction to Data Visualization
  • Matplotlib for Data Visualization
  • Using Matplotlib to draw plots
  • Visualizing & Customizing Plot appearances using Matplotlib
  • Multiple Line PLots
  • Basics of Time serious
  • Time Series Plotting and adding styles to the plots
  • Slicing and Customizing Time Series Data
  • Twin Axes Plotting
  • Bar Plot and Box Plots
  • Violin, Histogram and Scatter
  • Contour Plot and Annotations in Matplotlib
  • Advance Annotations
  • Image Tutorial in matplotlib
Intermediate Module
  • Introduction to Seaborn Library
  • Relational Plots and Subplots in Seaborn
  • Subplotting in Rows and Columns using Relational Plot
  • Line Plots in Seaborn
  • Bar Plots, Box Plots and Point Plots in Seaborn
  • Colour Palettes in Seaborn
Advanced Module
  • Introduction to BOKEH
  • Patch Plots and Scatter Marks in Bokeh
  • Area Plots and Circle Glyphs in Bokeh
  • Rectangle, Oval and Polygon Glyphs in Bokeh
  • Wedges, Arcs and Specialized curves in Bokeh
  • Setting Plot ranges and Axes in Bokeh Plots
  • Twin Axes, Datetime axes and Annotations in Bokeh Plots
  • Categorical and Log Axes in Bokeh
  • Row and Column Layouts in Bokeh Plots
  • Customizing Tools and Legends in Bokeh Plots
  • Column Data Source and Adding Widgets to Bokeh Plots
Data Analysis using Pandas Syllabus:
Beginner Module
  • Introduction
  • Setting up Pandas Environment
  • An Introduction to Jupyter Notebook
  • Loading Data into Pandas
  • A Deeper Look Into Data
  • DataFrames - Basic Functions
  • Dataframes- rows and columns
Intermediate Module
  • Sorting DataFrames
  • Handling Datetime Fields in Pandas
  • Statistical Functions in Pandas
Advanced Module
  • Pandas - Indexes
  • Data Grouped Representation
  • Data Visualization
  • Adding New Data - Merge, Join
  • Adding New Data - Append/Concat
  • Final Project & End Note
Machine Learning Syllabus:
Machine Learning

About Machine Learning Course
Installation of Anaconda
What is Machine Learning
Types of Machine Learning, Supervised Learning and Regression
Types of ML,Logistic Regression and Unsupervised Learning
SVM -What is SVM and How do they work
SVM-Loading and Examining our dataset
SVM-Building and Tweaking our SVM Classification mode
What is Decision Tree?
Building the Decision Tree : Decision Tree Learning
Building a Decision Tree - Information Gain a Gini Impurity
Decision Tree Lab:Building our First Decision Tree
Decision Tree Lab:Viewing and Tweaking our Decision Tree
What is Overfitting
Random Forest Lab
Teamwork
Avoiding Overfitted Models

Kickstart Your Learning Today
Name*
Phone number*
Please fill all the required fields!
Please accept terms and conditions to proceed
Please wait